|
|
2007-08 Massachusetts State Report Card
Part II - State Achievement in English Language Arts, Mathematics & Science and Technology/Engineering2007 MCAS Results by Student Group by Grade and SubjectStudent Status, Low Income, Migrant information was as reported by the principals or designees.
Race & Gender are as reported by the students.
NOTE: AYP Participation Rates are calculated using the AYP participation rules. More about the data
| GRADE LEVEL 3 - READING |
|---|
| Student Group |
State |
| Students Included |
AYP Part.** |
% at Each Level |
CPI |
| # |
% |
A |
P |
NI |
W |
| AYP Subgroups |
| Stud. w/ Disab | 12,390 | 100 | 3 |
24 |
44 |
29 |
67.5 |
| EL/Former EL | 6,712 | 100 | 4 |
25 |
46 |
25 |
64.9 |
| Low-Income | 22,293 | 100 | 4 |
32 |
46 |
18 |
71.7 |
| African American/Black | 5,577 | 100 | 5 |
31 |
47 |
18 |
71.5 |
| Asian | 3,456 | 100 | 20 |
44 |
28 |
8 |
85.5 |
| Hispanic/Latino | 9,641 | 100 | 4 |
28 |
46 |
22 |
68.2 |
| Native American | 204 | 100 | 6 |
40 |
45 |
10 |
78.3 |
| White | 50,888 | 100 | 16 |
50 |
28 |
6 |
87.7 |
| |
| Other Student Groups |
| Male | 36,704 | 100 | 12 |
44 |
33 |
10 |
82.1 |
| Female | 34,577 | 100 | 16 |
46 |
30 |
7 |
85.1 |
| Title I | 23,029 | 100 | 5 |
33 |
45 |
17 |
72.5 |
| Non-Title I | 48,252 | 100 | 18 |
51 |
26 |
5 |
88.8 |
| Non-Low Income | 48,988 | 100 | 18 |
51 |
26 |
5 |
88.9 |
| EL | 4,799 | 100 | 2 |
20 |
48 |
30 |
60.3 |
| Former EL | 1,913 | 100 | 8 |
36 |
42 |
13 |
76.3 |
| 1st Yr EL* | 540 | 96 | - |
- |
- |
- |
- |
| Migrant | 21 | 100 | 5 |
57 |
33 |
5 |
81.0 |
| Native Hawaiian/ Pacific Islander | 166 | 100 | 14 |
48 |
32 |
7 |
86.1 |
| Multi-race - Non-Hispanic/Latino | 1,349 | 100 | 13 |
45 |
33 |
9 |
83.0 |
| |
| All Students |
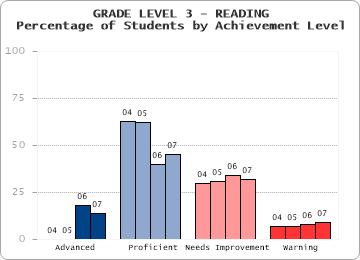
| 2007 | 71,311 | 100 | 14 |
45 |
32 |
9 |
83.5 |
| 2006 | 70,751 | 100 | 18 |
40 |
34 |
8 |
83.4 |
 |
| GRADE LEVEL 3 - MATHEMATICS |
|---|
| Student Group |
State |
| Students Included |
AYP Part.** |
% at Each Level |
CPI |
| # |
% |
A |
P |
NI |
W |
| AYP Subgroups |
| Stud. w/ Disab | 12,365 | 100 | 5 |
23 |
30 |
42 |
62.1 |
| EL/Former EL | 6,710 | 100 | 7 |
28 |
29 |
36 |
63.1 |
| Low-Income | 22,299 | 100 | 7 |
31 |
31 |
31 |
66.8 |
| African American/Black | 5,575 | 100 | 6 |
29 |
32 |
33 |
64.6 |
| Asian | 3,454 | 100 | 31 |
39 |
18 |
11 |
86.1 |
| Hispanic/Latino | 9,648 | 100 | 7 |
28 |
31 |
35 |
63.6 |
| Native American | 202 | 99 | 10 |
41 |
29 |
20 |
74.5 |
| White | 50,892 | 100 | 22 |
45 |
22 |
11 |
84.8 |
| |
| Other Student Groups |
| Male | 36,728 | 100 | 20 |
40 |
24 |
16 |
80.6 |
| Female | 34,561 | 100 | 18 |
42 |
25 |
16 |
80.0 |
| Title I | 23,033 | 100 | 8 |
32 |
31 |
29 |
67.8 |
| Non-Title I | 48,256 | 100 | 24 |
45 |
21 |
10 |
86.3 |
| Non-Low Income | 48,990 | 100 | 24 |
46 |
21 |
9 |
86.5 |
| EL | 4,805 | 100 | 5 |
25 |
30 |
40 |
59.4 |
| Former EL | 1,905 | 100 | 14 |
34 |
27 |
25 |
72.5 |
| 1st Yr EL* | 573 | 100 | - |
- |
- |
- |
- |
| Migrant | 21 | 100 | 5 |
48 |
24 |
24 |
72.6 |
| Native Hawaiian/ Pacific Islander | 167 | 100 | 25 |
38 |
25 |
13 |
83.5 |
| Multi-race - Non-Hispanic/Latino | 1,351 | 100 | 18 |
39 |
25 |
17 |
78.9 |
| |
| All Students |
| 2007 | 71,323 | 100 | 19 |
41 |
24 |
16 |
80.3 |
| 2006 | 70,741 | 100 | 4 |
48 |
32 |
16 |
78.0 |
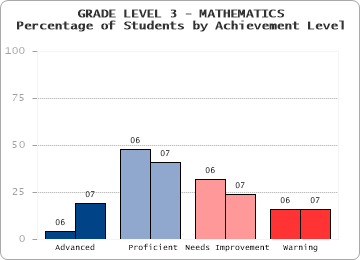 |
| * Note: The Above Proficient standard in grade 3 Mathematics was reset in 2007 to better discriminate student performance in the top reporting category. Therefore, comparisons should not be made between the percent Above Proficient in 2006 and 2007. However, comparisons may be drawn between the combined percent of students scoring Proficient and Above Proficient in 2006 and 2007. |
| GRADE LEVEL 4 - ENGLISH LANGUAGE ARTS |
|---|
| Student Group |
State |
| Students Included |
AYP Part.** |
% at Each Level |
CPI |
| # |
% |
A |
P |
NI |
W |
| AYP Subgroups |
| Stud. w/ Disab | 12,827 | 100 | 1 |
18 |
47 |
34 |
61.5 |
| EL/Former EL | 6,127 | 99 | 3 |
24 |
46 |
28 |
62.2 |
| Low-Income | 21,823 | 100 | 3 |
29 |
48 |
21 |
67.4 |
| African American/Black | 5,436 | 100 | 3 |
29 |
48 |
21 |
67.1 |
| Asian | 3,371 | 100 | 17 |
46 |
29 |
8 |
84.4 |
| Hispanic/Latino | 9,220 | 100 | 2 |
26 |
47 |
25 |
64.6 |
| Native American | 232 | 100 | 4 |
38 |
43 |
15 |
73.9 |
| White | 50,751 | 100 | 12 |
51 |
30 |
6 |
85.5 |
| |
| Other Student Groups |
| Male | 36,215 | 100 | 7 |
43 |
38 |
12 |
78.4 |
| Female | 34,277 | 100 | 14 |
48 |
30 |
8 |
84.2 |
| Title I | 22,313 | 100 | 3 |
31 |
48 |
18 |
68.9 |
| Non-Title I | 48,179 | 100 | 13 |
53 |
28 |
6 |
86.9 |
| Non-Low Income | 48,669 | 100 | 13 |
54 |
28 |
5 |
87.4 |
| EL | 3,917 | 99 | 1 |
16 |
47 |
36 |
54.9 |
| Former EL | 2,210 | 100 | 6 |
38 |
42 |
13 |
75.1 |
| 1st Yr EL* | 541 | 97 | - |
- |
- |
- |
- |
| Migrant | 8 | - | - | - | - | - | - |
| Native Hawaiian/ Pacific Islander | 163 | 100 | 6 |
51 |
37 |
6 |
84.0 |
| Multi-race - Non-Hispanic/Latino | 1,319 | 100 | 10 |
46 |
34 |
10 |
81.1 |
| |
| All Students |
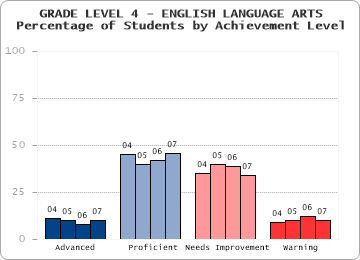
| 2007 | 70,517 | 100 | 10 |
46 |
34 |
10 |
81.2 |
| 2006 | 71,277 | 100 | 8 |
42 |
39 |
12 |
78.8 |
 |
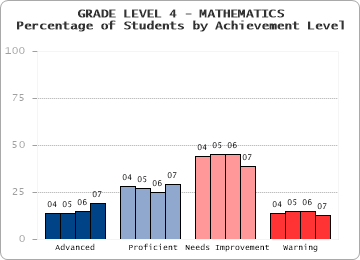
| GRADE LEVEL 4 - MATHEMATICS |
|---|
| Student Group |
State |
| Students Included |
AYP Part.** |
% at Each Level |
CPI |
| # |
% |
A |
P |
NI |
W |
| AYP Subgroups |
| Stud. w/ Disab | 12,858 | 100 | 4 |
13 |
46 |
37 |
59.6 |
| EL/Former EL | 6,149 | 100 | 8 |
18 |
45 |
29 |
61.0 |
| Low-Income | 21,841 | 100 | 7 |
20 |
48 |
25 |
63.8 |
| African American/Black | 5,433 | 100 | 6 |
17 |
50 |
27 |
60.4 |
| Asian | 3,386 | 100 | 32 |
31 |
30 |
7 |
84.4 |
| Hispanic/Latino | 9,238 | 100 | 6 |
18 |
48 |
28 |
61.2 |
| Native American | 229 | 100 | 10 |
21 |
50 |
19 |
68.1 |
| White | 50,847 | 100 | 21 |
33 |
37 |
9 |
81.2 |
| |
| Other Student Groups |
| Male | 36,269 | 100 | 19 |
30 |
39 |
13 |
77.4 |
| Female | 34,348 | 100 | 18 |
29 |
40 |
13 |
76.7 |
| Title I | 22,317 | 100 | 8 |
21 |
48 |
23 |
65.1 |
| Non-Title I | 48,300 | 100 | 23 |
33 |
35 |
8 |
82.5 |
| Non-Low Income | 48,776 | 100 | 24 |
34 |
35 |
7 |
83.0 |
| EL | 3,943 | 100 | 5 |
14 |
46 |
35 |
55.3 |
| Former EL | 2,206 | 100 | 14 |
25 |
44 |
17 |
71.2 |
| 1st Yr EL* | 566 | 100 | - |
- |
- |
- |
- |
| Migrant | 8 | - | - | - | - | - | - |
| Native Hawaiian/ Pacific Islander | 161 | 100 | 18 |
34 |
37 |
11 |
81.2 |
| Multi-race - Non-Hispanic/Latino | 1,323 | 100 | 20 |
31 |
34 |
15 |
77.0 |
| |
| All Students |
| 2007 | 70,645 | 100 | 19 |
29 |
39 |
13 |
77.0 |
| 2006 | 71,417 | 100 | 15 |
25 |
45 |
15 |
73.3 |
 |
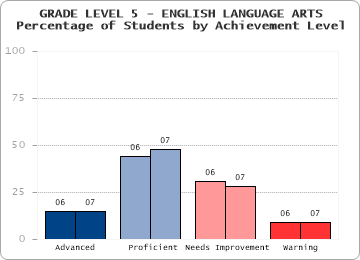
| GRADE LEVEL 5 - ENGLISH LANGUAGE ARTS |
|---|
| Student Group |
State |
| Students Included |
AYP Part.** |
% at Each Level |
CPI |
| # |
% |
A |
P |
NI |
W |
| AYP Subgroups |
| Stud. w/ Disab | 13,249 | 100 | 2 |
23 |
43 |
31 |
65.5 |
| EL/Former EL | 5,879 | 100 | 4 |
26 |
42 |
28 |
63.8 |
| Low-Income | 21,867 | 100 | 4 |
34 |
43 |
18 |
72.0 |
| African American/Black | 5,561 | 100 | 4 |
35 |
43 |
18 |
72.4 |
| Asian | 3,438 | 100 | 23 |
45 |
25 |
7 |
86.6 |
| Hispanic/Latino | 9,208 | 100 | 4 |
30 |
43 |
23 |
68.3 |
| Native American | 202 | 100 | 8 |
42 |
40 |
10 |
80.7 |
| White | 51,496 | 100 | 17 |
53 |
24 |
5 |
88.7 |
| |
| Other Student Groups |
| Male | 36,834 | 100 | 11 |
48 |
31 |
11 |
82.4 |
| Female | 34,444 | 100 | 19 |
48 |
26 |
7 |
86.9 |
| Title I | 20,864 | 100 | 5 |
35 |
42 |
17 |
72.9 |
| Non-Title I | 50,414 | 100 | 19 |
53 |
23 |
5 |
89.4 |
| Non-Low Income | 49,411 | 100 | 19 |
54 |
22 |
5 |
90.2 |
| EL | 3,235 | 100 | 1 |
15 |
43 |
41 |
53.0 |
| Former EL | 2,644 | 100 | 6 |
39 |
42 |
12 |
77.0 |
| 1st Yr EL* | 499 | 98 | - |
- |
- |
- |
- |
| Migrant | 14 | 100 | 0 |
14 |
57 |
29 |
53.6 |
| Native Hawaiian/ Pacific Islander | 173 | 100 | 8 |
50 |
28 |
15 |
81.2 |
| Multi-race - Non-Hispanic/Latino | 1,200 | 100 | 14 |
46 |
32 |
8 |
84.0 |
| |
| All Students |
| 2007 | 71,320 | 100 | 15 |
48 |
28 |
9 |
84.6 |
| 2006 | 72,714 | 100 | 15 |
44 |
31 |
9 |
83.7 |
 |
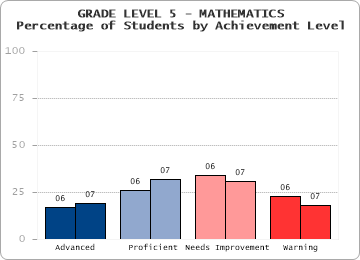
| GRADE LEVEL 5 - MATHEMATICS |
|---|
| Student Group |
State |
| Students Included |
AYP Part.** |
% at Each Level |
CPI |
| # |
% |
A |
P |
NI |
W |
| AYP Subgroups |
| Stud. w/ Disab | 13,249 | 100 | 3 |
14 |
33 |
50 |
53.8 |
| EL/Former EL | 5,888 | 100 | 8 |
21 |
33 |
38 |
58.5 |
| Low-Income | 21,838 | 100 | 7 |
22 |
38 |
33 |
61.1 |
| African American/Black | 5,560 | 100 | 5 |
20 |
38 |
36 |
59.0 |
| Asian | 3,453 | 100 | 36 |
34 |
21 |
9 |
86.1 |
| Hispanic/Latino | 9,224 | 100 | 6 |
20 |
36 |
39 |
57.5 |
| Native American | 200 | 100 | 12 |
34 |
30 |
25 |
71.1 |
| White | 51,493 | 100 | 21 |
36 |
30 |
13 |
80.1 |
| |
| Other Student Groups |
| Male | 36,843 | 100 | 20 |
33 |
30 |
18 |
76.5 |
| Female | 34,459 | 100 | 18 |
32 |
32 |
18 |
74.8 |
| Title I | 20,854 | 100 | 8 |
23 |
37 |
32 |
62.1 |
| Non-Title I | 50,448 | 100 | 23 |
36 |
28 |
12 |
81.3 |
| Non-Low Income | 49,464 | 100 | 24 |
37 |
28 |
11 |
82.1 |
| EL | 3,254 | 100 | 4 |
15 |
31 |
50 |
50.0 |
| Former EL | 2,634 | 100 | 13 |
28 |
35 |
24 |
69.0 |
| 1st Yr EL* | 512 | 100 | - |
- |
- |
- |
- |
| Migrant | 14 | 100 | 0 |
14 |
36 |
50 |
51.8 |
| Native Hawaiian/ Pacific Islander | 173 | 100 | 18 |
34 |
29 |
18 |
75.4 |
| Multi-race - Non-Hispanic/Latino | 1,199 | 100 | 20 |
29 |
32 |
19 |
74.5 |
| |
| All Students |
| 2007 | 71,352 | 100 | 19 |
32 |
31 |
18 |
75.7 |
| 2006 | 72,798 | 100 | 17 |
26 |
34 |
23 |
70.2 |
 |
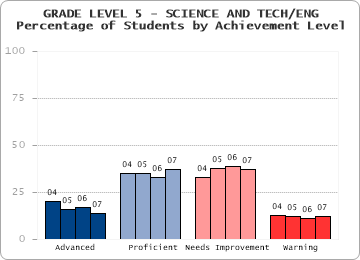
| GRADE LEVEL 5 - SCIENCE AND TECH/ENG |
|---|
| Student Group |
State |
| Students Included |
AYP Part.** |
% at Each Level |
CPI |
| # |
% |
A |
P |
NI |
W |
| AYP Subgroups |
| Stud. w/ Disab | 13,245 | 100 | 3 |
18 |
45 |
33 |
63.0 |
| EL/Former EL | 5,885 | 100 | 3 |
16 |
46 |
36 |
56.1 |
| Low-Income | 21,833 | 100 | 3 |
21 |
49 |
26 |
63.5 |
| African American/Black | 5,560 | 100 | 2 |
18 |
50 |
30 |
59.4 |
| Asian | 3,451 | 100 | 23 |
36 |
32 |
10 |
82.1 |
| Hispanic/Latino | 9,219 | 100 | 3 |
17 |
49 |
31 |
59.5 |
| Native American | 199 | 99 | 6 |
32 |
45 |
17 |
73.1 |
| White | 51,484 | 100 | 17 |
42 |
34 |
7 |
84.3 |
| |
| Other Student Groups |
| Male | 36,839 | 100 | 14 |
38 |
36 |
12 |
79.7 |
| Female | 34,447 | 100 | 14 |
35 |
38 |
12 |
78.0 |
| Title I | 20,849 | 100 | 4 |
22 |
49 |
25 |
63.9 |
| Non-Title I | 50,437 | 100 | 18 |
43 |
32 |
7 |
85.1 |
| Non-Low Income | 49,453 | 100 | 19 |
43 |
32 |
6 |
85.7 |
| EL | 3,252 | 100 | 1 |
9 |
42 |
48 |
48.0 |
| Former EL | 2,633 | 100 | 4 |
24 |
51 |
21 |
66.1 |
| 1st Yr EL* | 512 | 100 | - |
- |
- |
- |
- |
| Migrant | 14 | 100 | 0 |
0 |
57 |
43 |
44.6 |
| Native Hawaiian/ Pacific Islander | 173 | 100 | 7 |
36 |
41 |
16 |
75.7 |
| Multi-race - Non-Hispanic/Latino | 1,200 | 100 | 15 |
34 |
40 |
11 |
78.4 |
| |
| All Students |
| 2007 | 71,338 | 100 | 14 |
37 |
37 |
12 |
78.9 |
| 2006 | 72,769 | 100 | 17 |
33 |
39 |
11 |
78.0 |
 |
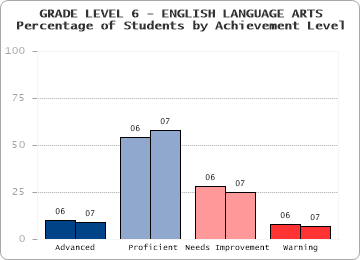
| GRADE LEVEL 6 - ENGLISH LANGUAGE ARTS |
|---|
| Student Group |
State |
| Students Included |
AYP Part.** |
% at Each Level |
CPI |
| # |
% |
A |
P |
NI |
W |
| AYP Subgroups |
| Stud. w/ Disab | 13,657 | 99 | 1 |
26 |
45 |
28 |
66.9 |
| EL/Former EL | 4,641 | 99 | 1 |
26 |
44 |
29 |
62.7 |
| Low-Income | 22,513 | 100 | 2 |
40 |
42 |
16 |
74.1 |
| African American/Black | 6,109 | 100 | 3 |
40 |
43 |
15 |
74.2 |
| Asian | 3,328 | 100 | 17 |
55 |
22 |
6 |
88.6 |
| Hispanic/Latino | 9,312 | 99 | 2 |
36 |
42 |
20 |
70.3 |
| Native American | 226 | 100 | 4 |
48 |
37 |
11 |
79.4 |
| White | 52,437 | 100 | 11 |
64 |
21 |
4 |
90.6 |
| |
| Other Student Groups |
| Male | 37,591 | 100 | 6 |
56 |
29 |
9 |
83.9 |
| Female | 35,257 | 100 | 13 |
60 |
22 |
5 |
89.0 |
| Title I | 19,370 | 100 | 3 |
41 |
41 |
15 |
74.4 |
| Non-Title I | 53,478 | 100 | 12 |
64 |
20 |
5 |
90.7 |
| Non-Low Income | 50,335 | 100 | 12 |
66 |
18 |
4 |
91.9 |
| EL | 2,657 | 99 | 0 |
15 |
44 |
40 |
52.9 |
| Former EL | 1,984 | 100 | 2 |
42 |
43 |
13 |
75.8 |
| 1st Yr EL* | 488 | 97 | - |
- |
- |
- |
- |
| Migrant | 12 | 100 | 0 |
8 |
50 |
42 |
50.0 |
| Native Hawaiian/ Pacific Islander | 164 | 99 | 6 |
55 |
26 |
13 |
83.1 |
| Multi-race - Non-Hispanic/Latino | 1,272 | 99 | 12 |
55 |
26 |
7 |
86.7 |
| |
| All Students |
| 2007 | 72,887 | 100 | 9 |
58 |
25 |
7 |
86.4 |
| 2006 | 73,382 | 100 | 10 |
54 |
28 |
8 |
84.9 |
 |
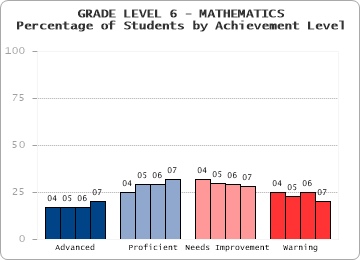
| GRADE LEVEL 6 - MATHEMATICS |
|---|
| Student Group |
State |
| Students Included |
AYP Part.** |
% at Each Level |
CPI |
| # |
% |
A |
P |
NI |
W |
| AYP Subgroups |
| Stud. w/ Disab | 13,618 | 99 | 3 |
13 |
30 |
54 |
51.3 |
| EL/Former EL | 4,672 | 100 | 6 |
17 |
28 |
48 |
52.3 |
| Low-Income | 22,492 | 100 | 7 |
22 |
33 |
38 |
59.0 |
| African American/Black | 6,091 | 100 | 6 |
21 |
33 |
41 |
56.7 |
| Asian | 3,337 | 100 | 40 |
31 |
19 |
10 |
86.2 |
| Hispanic/Latino | 9,336 | 100 | 6 |
19 |
32 |
44 |
55.1 |
| Native American | 226 | 100 | 10 |
23 |
34 |
34 |
63.2 |
| White | 52,421 | 100 | 24 |
36 |
27 |
13 |
80.8 |
| |
| Other Student Groups |
| Male | 37,588 | 100 | 21 |
31 |
27 |
20 |
75.3 |
| Female | 35,259 | 100 | 20 |
33 |
28 |
19 |
75.7 |
| Title I | 19,385 | 100 | 8 |
22 |
33 |
37 |
59.3 |
| Non-Title I | 53,462 | 100 | 25 |
36 |
26 |
13 |
81.4 |
| Non-Low Income | 50,355 | 100 | 26 |
37 |
25 |
11 |
82.9 |
| EL | 2,700 | 100 | 4 |
11 |
25 |
59 |
44.0 |
| Former EL | 1,972 | 100 | 10 |
25 |
33 |
33 |
63.5 |
| 1st Yr EL* | 509 | 100 | - |
- |
- |
- |
- |
| Migrant | 12 | 100 | 0 |
0 |
58 |
42 |
45.8 |
| Native Hawaiian/ Pacific Islander | 164 | 99 | 16 |
28 |
32 |
24 |
69.7 |
| Multi-race - Non-Hispanic/Latino | 1,272 | 100 | 22 |
31 |
27 |
21 |
74.4 |
| |
| All Students |
| 2007 | 72,889 | 100 | 20 |
32 |
28 |
20 |
75.5 |
| 2006 | 73,470 | 100 | 17 |
29 |
29 |
25 |
70.5 |
 |
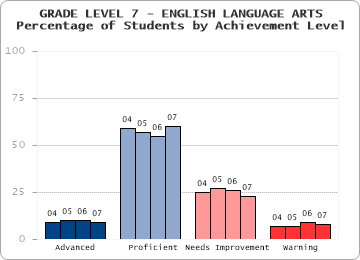
| GRADE LEVEL 7 - ENGLISH LANGUAGE ARTS |
|---|
| Student Group |
State |
| Students Included |
AYP Part.** |
% at Each Level |
CPI |
| # |
% |
A |
P |
NI |
W |
| AYP Subgroups |
| Stud. w/ Disab | 13,247 | 99 | 1 |
27 |
43 |
30 |
65.8 |
| EL/Former EL | 4,244 | 100 | 1 |
28 |
39 |
32 |
61.3 |
| Low-Income | 22,660 | 100 | 2 |
44 |
37 |
16 |
75.0 |
| African American/Black | 6,105 | 100 | 2 |
46 |
36 |
16 |
75.8 |
| Asian | 3,336 | 100 | 17 |
58 |
19 |
6 |
89.2 |
| Hispanic/Latino | 9,397 | 100 | 2 |
40 |
37 |
21 |
71.5 |
| Native American | 222 | 99 | 8 |
49 |
32 |
12 |
82.1 |
| White | 53,223 | 100 | 11 |
65 |
19 |
5 |
90.8 |
| |
| Other Student Groups |
| Male | 38,107 | 100 | 6 |
58 |
27 |
10 |
84.1 |
| Female | 35,434 | 100 | 13 |
62 |
19 |
5 |
89.9 |
| Title I | 16,636 | 100 | 2 |
45 |
37 |
16 |
75.0 |
| Non-Title I | 56,905 | 100 | 11 |
64 |
19 |
5 |
90.4 |
| Non-Low Income | 50,881 | 100 | 13 |
67 |
17 |
4 |
92.2 |
| EL | 2,479 | 99 | 1 |
15 |
40 |
45 |
51.2 |
| Former EL | 1,765 | 100 | 2 |
45 |
39 |
14 |
75.5 |
| 1st Yr EL* | 553 | 99 | - |
- |
- |
- |
- |
| Migrant | 13 | 100 | 0 |
15 |
46 |
38 |
53.8 |
| Native Hawaiian/ Pacific Islander | 159 | 100 | 11 |
57 |
24 |
8 |
86.8 |
| Multi-race - Non-Hispanic/Latino | 1,099 | 99 | 9 |
61 |
24 |
6 |
87.4 |
| |
| All Students |
| 2007 | 73,577 | 100 | 9 |
60 |
23 |
8 |
86.9 |
| 2006 | 74,509 | 100 | 10 |
55 |
26 |
9 |
84.6 |
 |
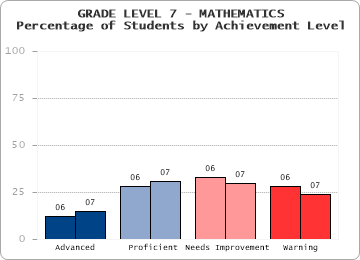
| GRADE LEVEL 7 - MATHEMATICS |
|---|
| Student Group |
State |
| Students Included |
AYP Part.** |
% at Each Level |
CPI |
| # |
% |
A |
P |
NI |
W |
| AYP Subgroups |
| Stud. w/ Disab | 13,230 | 99 | 2 |
10 |
27 |
61 |
45.8 |
| EL/Former EL | 4,270 | 99 | 4 |
13 |
26 |
56 |
45.8 |
| Low-Income | 22,659 | 99 | 4 |
18 |
33 |
45 |
52.9 |
| African American/Black | 6,105 | 100 | 3 |
17 |
34 |
47 |
50.9 |
| Asian | 3,341 | 100 | 32 |
32 |
22 |
14 |
81.7 |
| Hispanic/Latino | 9,403 | 99 | 3 |
16 |
31 |
50 |
49.9 |
| Native American | 223 | 100 | 9 |
20 |
34 |
37 |
59.8 |
| White | 53,212 | 100 | 17 |
35 |
30 |
18 |
75.7 |
| |
| Other Student Groups |
| Male | 38,120 | 100 | 15 |
30 |
29 |
26 |
69.9 |
| Female | 35,429 | 100 | 14 |
32 |
32 |
23 |
71.0 |
| Title I | 16,649 | 100 | 4 |
17 |
34 |
45 |
52.3 |
| Non-Title I | 56,900 | 100 | 18 |
35 |
29 |
18 |
75.7 |
| Non-Low Income | 50,890 | 100 | 19 |
37 |
29 |
15 |
78.2 |
| EL | 2,511 | 99 | 2 |
8 |
21 |
68 |
38.2 |
| Former EL | 1,759 | 100 | 7 |
20 |
33 |
40 |
56.6 |
| 1st Yr EL* | 574 | 100 | - |
- |
- |
- |
- |
| Migrant | 13 | 100 | 0 |
8 |
38 |
54 |
36.5 |
| Native Hawaiian/ Pacific Islander | 161 | 100 | 16 |
35 |
25 |
24 |
73.9 |
| Multi-race - Non-Hispanic/Latino | 1,104 | 100 | 16 |
27 |
31 |
27 |
67.5 |
| |
| All Students |
| 2007 | 73,592 | 100 | 15 |
31 |
30 |
24 |
70.4 |
| 2006 | 74,647 | 100 | 12 |
28 |
33 |
28 |
66.6 |
 |
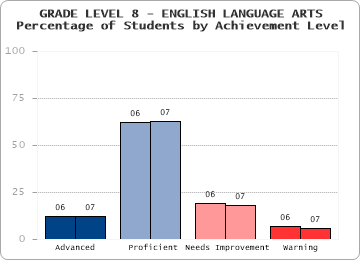
| GRADE LEVEL 8 - ENGLISH LANGUAGE ARTS |
|---|
| Student Group |
State |
| Students Included |
AYP Part.** |
% at Each Level |
CPI |
| # |
% |
A |
P |
NI |
W |
| AYP Subgroups |
| Stud. w/ Disab | 13,179 | 99 | 1 |
35 |
39 |
25 |
70.9 |
| EL/Former EL | 3,824 | 99 | 2 |
28 |
42 |
29 |
62.9 |
| Low-Income | 22,257 | 99 | 3 |
51 |
32 |
13 |
79.4 |
| African American/Black | 6,412 | 99 | 4 |
52 |
32 |
13 |
79.7 |
| Asian | 3,162 | 100 | 19 |
58 |
17 |
5 |
90.5 |
| Hispanic/Latino | 9,403 | 99 | 3 |
45 |
35 |
17 |
75.2 |
| Native American | 235 | 100 | 6 |
63 |
24 |
8 |
86.2 |
| White | 54,024 | 100 | 15 |
68 |
14 |
4 |
93.1 |
| |
| Other Student Groups |
| Male | 38,446 | 100 | 8 |
63 |
21 |
8 |
87.3 |
| Female | 35,925 | 100 | 17 |
63 |
15 |
4 |
91.9 |
| Title I | 16,025 | 99 | 3 |
51 |
32 |
13 |
79.4 |
| Non-Title I | 58,346 | 100 | 15 |
66 |
15 |
4 |
92.3 |
| Non-Low Income | 52,114 | 100 | 16 |
68 |
12 |
3 |
93.9 |
| EL | 2,477 | 99 | 0 |
17 |
43 |
40 |
54.5 |
| Former EL | 1,347 | 100 | 3 |
47 |
38 |
11 |
78.5 |
| 1st Yr EL* | 498 | 99 | - |
- |
- |
- |
- |
| Migrant | 10 | 100 | 0 |
20 |
30 |
50 |
50.0 |
| Native Hawaiian/ Pacific Islander | 141 | 100 | 11 |
74 |
13 |
1 |
94.9 |
| Multi-race - Non-Hispanic/Latino | 994 | 100 | 14 |
61 |
19 |
6 |
89.1 |
| |
| All Students |
| 2007 | 74,433 | 100 | 12 |
63 |
18 |
6 |
89.5 |
| 2006 | 76,243 | 100 | 12 |
62 |
19 |
7 |
88.3 |
 |
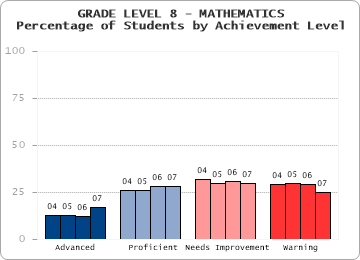
| GRADE LEVEL 8 - MATHEMATICS |
|---|
| Student Group |
State |
| Students Included |
AYP Part.** |
% at Each Level |
CPI |
| # |
% |
A |
P |
NI |
W |
| AYP Subgroups |
| Stud. w/ Disab | 13,120 | 99 | 2 |
8 |
26 |
64 |
43.9 |
| EL/Former EL | 3,821 | 99 | 4 |
11 |
24 |
61 |
44.2 |
| Low-Income | 22,173 | 99 | 5 |
16 |
33 |
45 |
52.9 |
| African American/Black | 6,397 | 99 | 4 |
15 |
34 |
47 |
50.8 |
| Asian | 3,164 | 100 | 34 |
31 |
22 |
14 |
81.7 |
| Hispanic/Latino | 9,358 | 99 | 4 |
14 |
30 |
52 |
49.0 |
| Native American | 237 | 100 | 8 |
24 |
38 |
31 |
61.7 |
| White | 53,967 | 100 | 20 |
32 |
30 |
18 |
75.6 |
| |
| Other Student Groups |
| Male | 38,389 | 100 | 17 |
27 |
29 |
26 |
69.6 |
| Female | 35,872 | 100 | 17 |
29 |
31 |
24 |
70.7 |
| Title I | 15,984 | 99 | 5 |
17 |
33 |
45 |
52.8 |
| Non-Title I | 58,277 | 100 | 21 |
31 |
29 |
19 |
74.9 |
| Non-Low Income | 52,088 | 100 | 22 |
33 |
29 |
16 |
77.5 |
| EL | 2,490 | 99 | 2 |
8 |
21 |
69 |
39.4 |
| Former EL | 1,331 | 99 | 7 |
18 |
29 |
46 |
53.1 |
| 1st Yr EL* | 515 | 100 | - |
- |
- |
- |
- |
| Migrant | 10 | 100 | 0 |
0 |
40 |
60 |
37.5 |
| Native Hawaiian/ Pacific Islander | 141 | 99 | 16 |
32 |
30 |
22 |
72.5 |
| Multi-race - Non-Hispanic/Latino | 997 | 100 | 18 |
26 |
28 |
29 |
67.7 |
| |
| All Students |
| 2007 | 74,319 | 100 | 17 |
28 |
30 |
25 |
70.2 |
| 2006 | 76,276 | 100 | 12 |
28 |
31 |
29 |
66.3 |
 |
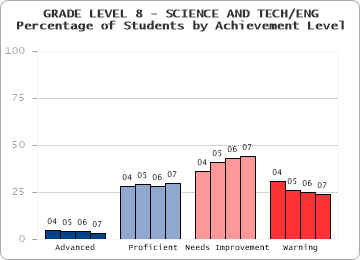
| GRADE LEVEL 8 - SCIENCE AND TECH/ENG |
|---|
| Student Group |
State |
| Students Included |
AYP Part.** |
% at Each Level |
CPI |
| # |
% |
A |
P |
NI |
W |
| AYP Subgroups |
| Stud. w/ Disab | 13,087 | 99 | 0 |
7 |
36 |
56 |
46.0 |
| EL/Former EL | 3,811 | 99 | 0 |
5 |
26 |
68 |
37.7 |
| Low-Income | 22,138 | 99 | 0 |
11 |
42 |
46 |
48.2 |
| African American/Black | 6,396 | 99 | 0 |
8 |
42 |
50 |
45.3 |
| Asian | 3,161 | 99 | 7 |
36 |
38 |
20 |
71.1 |
| Hispanic/Latino | 9,333 | 99 | 0 |
7 |
37 |
55 |
43.3 |
| Native American | 237 | 100 | 0 |
20 |
46 |
34 |
57.4 |
| White | 53,935 | 100 | 3 |
36 |
45 |
15 |
72.0 |
| |
| Other Student Groups |
| Male | 38,336 | 99 | 3 |
32 |
42 |
23 |
68.0 |
| Female | 35,862 | 100 | 2 |
27 |
46 |
25 |
63.8 |
| Title I | 15,964 | 99 | 1 |
10 |
42 |
48 |
47.2 |
| Non-Title I | 58,234 | 100 | 4 |
35 |
44 |
17 |
71.1 |
| Non-Low Income | 52,060 | 100 | 4 |
38 |
44 |
14 |
73.5 |
| EL | 2,482 | 99 | 0 |
3 |
20 |
77 |
33.3 |
| Former EL | 1,329 | 99 | 1 |
10 |
39 |
51 |
45.8 |
| 1st Yr EL* | 516 | 100 | - |
- |
- |
- |
- |
| Migrant | 10 | 100 | 0 |
10 |
20 |
70 |
32.5 |
| Native Hawaiian/ Pacific Islander | 141 | 99 | 1 |
23 |
59 |
17 |
66.0 |
| Multi-race - Non-Hispanic/Latino | 995 | 100 | 5 |
27 |
42 |
26 |
64.4 |
| |
| All Students |
| 2007 | 74,257 | 99 | 3 |
30 |
44 |
24 |
65.9 |
| 2006 | 76,234 | 100 | 4 |
28 |
43 |
25 |
65.6 |
 |
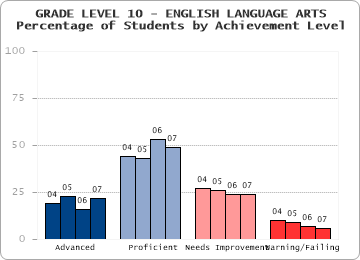
| GRADE LEVEL 10 - ENGLISH LANGUAGE ARTS |
|---|
| Student Group |
State |
| Students Included |
AYP Part.** |
% at Each Level |
CPI |
| # |
% |
A |
P |
NI |
F |
| AYP Subgroups |
| Stud. w/ Disab | 11,465 | 98 | 2 |
28 |
47 |
23 |
68.6 |
| EL/Former EL | 3,502 | 99 | 2 |
20 |
47 |
31 |
58.8 |
| Low-Income | 18,294 | 99 | 7 |
41 |
40 |
13 |
76.9 |
| African American/Black | 6,053 | 99 | 6 |
40 |
41 |
12 |
76.8 |
| Asian | 3,297 | 100 | 31 |
43 |
21 |
5 |
89.5 |
| Hispanic/Latino | 8,494 | 99 | 6 |
37 |
41 |
16 |
73.5 |
| Native American | 187 | 99 | 13 |
49 |
32 |
6 |
84.8 |
| White | 53,315 | 100 | 25 |
52 |
19 |
3 |
91.5 |
| |
| Other Student Groups |
| Male | 36,768 | 99 | 16 |
50 |
27 |
7 |
85.8 |
| Female | 35,596 | 99 | 28 |
48 |
20 |
4 |
90.3 |
| Title I | 9,596 | 99 | 5 |
39 |
43 |
13 |
75.4 |
| Non-Title I | 62,768 | 99 | 24 |
50 |
21 |
5 |
89.9 |
| Non-Low Income | 54,070 | 100 | 27 |
51 |
18 |
3 |
91.7 |
| EL | 2,258 | 98 | 1 |
12 |
46 |
42 |
50.5 |
| Former EL | 1,244 | 99 | 5 |
34 |
49 |
12 |
73.8 |
| 1st Yr EL* | 455 | 96 | - |
- |
- |
- |
- |
| Migrant | 1 | - | - | - | - | - | - |
| Native Hawaiian/ Pacific Islander | 118 | 99 | 19 |
47 |
20 |
14 |
83.9 |
| Multi-race - Non-Hispanic/Latino | 900 | 99 | 24 |
46 |
24 |
5 |
88.5 |
| |
| All Students |
| 2007 | 72,471 | 99 | 22 |
49 |
24 |
6 |
87.9 |
| 2006 | 73,351 | 99 | 16 |
53 |
24 |
7 |
86.8 |
 |
| GRADE LEVEL 10 - MATHEMATICS |
|---|
| Student Group |
State |
| Students Included |
AYP Part.** |
% at Each Level |
CPI |
| # |
% |
A |
P |
NI |
F |
| AYP Subgroups |
| Stud. w/ Disab | 11,241 | 98 | 9 |
22 |
37 |
32 |
63.9 |
| EL/Former EL | 3,422 | 98 | 16 |
18 |
34 |
32 |
62.6 |
| Low-Income | 17,910 | 98 | 21 |
26 |
33 |
19 |
72.9 |
| African American/Black | 5,945 | 98 | 19 |
26 |
35 |
20 |
71.5 |
| Asian | 3,258 | 99 | 64 |
18 |
13 |
5 |
91.9 |
| Hispanic/Latino | 8,279 | 98 | 18 |
24 |
34 |
24 |
68.9 |
| Native American | 183 | 96 | 32 |
22 |
33 |
12 |
77.9 |
| White | 52,917 | 99 | 46 |
29 |
19 |
6 |
88.8 |
| |
| Other Student Groups |
| Male | 36,328 | 99 | 42 |
27 |
21 |
10 |
84.6 |
| Female | 35,272 | 99 | 42 |
28 |
22 |
8 |
85.6 |
| Title I | 9,351 | 98 | 20 |
25 |
35 |
20 |
71.8 |
| Non-Title I | 62,249 | 99 | 45 |
28 |
20 |
8 |
87.1 |
| Non-Low Income | 53,690 | 99 | 48 |
28 |
18 |
6 |
89.1 |
| EL | 2,213 | 98 | 11 |
16 |
34 |
39 |
57.0 |
| Former EL | 1,209 | 99 | 24 |
23 |
35 |
19 |
72.8 |
| 1st Yr EL* | 462 | 99 | - |
- |
- |
- |
- |
| Migrant | 1 | - | - | - | - | - | - |
| Native Hawaiian/ Pacific Islander | 116 | 99 | 33 |
28 |
23 |
16 |
81.9 |
| Multi-race - Non-Hispanic/Latino | 902 | 99 | 39 |
28 |
23 |
10 |
84.0 |
| |
| All Students |
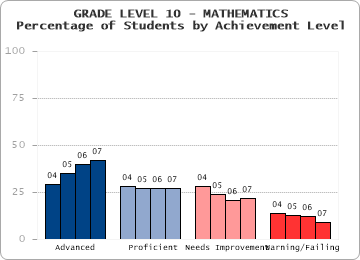
| 2007 | 71,692 | 99 | 42 |
27 |
22 |
9 |
85.0 |
| 2006 | 72,738 | 99 | 40 |
27 |
21 |
12 |
83.2 |
|


