|
|
2008-09 Massachusetts State Report Card
Part III - State Achievement in English Language Arts, Mathematics & Science and Technology/Engineering2008 MCAS Results by Student Group by Grade and SubjectStudent Status, Low Income, Migrant information was as reported by the principals or designees.
Race & Gender are as reported by the students.
More about the data
Data Last Updated on October 27, 2009
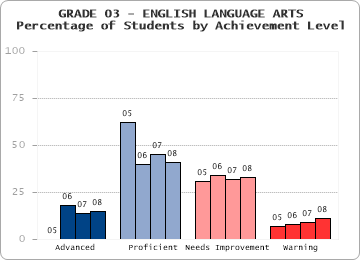
| GRADE LEVEL 3 - READING |
|---|
| Student Group |
State |
| Students Included |
AYP Part. |
% at Each Level |
CPI |
SGP |
Incl. in SGP (#) |
| # |
% |
A |
P |
NI |
W |
| AYP Subgroups |
| Stud. w/ Disab | 12,108 | 99 | 3 |
20 |
42 |
36 |
63.7 | N/A |
N/A |
| EL/Former EL | 6,989 | 99 | 4 |
22 |
44 |
30 |
62.3 | N/A |
N/A |
| Low-Income | 22,285 | 99 | 5 |
27 |
46 |
23 |
68.5 | N/A |
N/A |
| African American/Black | 5,540 | 99 | 6 |
27 |
45 |
23 |
68.2 | N/A |
N/A |
| Asian | 3,431 | 99 | 21 |
41 |
29 |
9 |
84.0 | N/A |
N/A |
| Hispanic/Latino | 10,073 | 99 | 4 |
25 |
45 |
26 |
65.5 | N/A |
N/A |
| Native American | 204 | 100 | 8 |
33 |
49 |
10 |
76.1 | N/A |
N/A |
| White | 49,487 | 100 | 18 |
45 |
29 |
7 |
86.1 | N/A |
N/A |
| |
| Other Student Groups |
| Male | 36,022 | 99 | 12 |
40 |
34 |
14 |
79.6 | N/A |
N/A |
| Female | 34,228 | 100 | 18 |
42 |
31 |
9 |
83.5 | N/A |
N/A |
| Title I | 23,025 | 99 | 6 |
28 |
45 |
21 |
69.6 | N/A |
N/A |
| Non-Title I | 47,225 | 100 | 20 |
47 |
27 |
7 |
87.4 | N/A |
N/A |
| Non-Low Income | 47,965 | 100 | 20 |
47 |
27 |
6 |
87.6 | N/A |
N/A |
| EL | 5,028 | 98 | 2 |
18 |
45 |
35 |
57.7 | N/A |
N/A |
| Former EL | 1,961 | 100 | 7 |
33 |
44 |
17 |
74.1 | N/A |
N/A |
| 1st Yr EL* | 461 | 91 | - |
- |
- |
- |
- | N/A |
N/A |
| Migrant | 5 | - | - | - | - | - | - | - | - |
| Native Hawaiian/ Pacific Islander | 69 | 97 | 9 |
42 |
42 |
7 |
82.2 | N/A |
N/A |
| Multi-race - Non-Hispanic/Latino | 1,446 | 99 | 15 |
39 |
34 |
12 |
80.8 | N/A |
N/A |
| |
| All Students |
| 2008 | 70,284 | 100 | 15 |
41 |
33 |
11 |
81.5 | N/A |
N/A |
| 2007 | 71,311 | 100 | 14 |
45 |
32 |
9 |
83.5 | N/A |
N/A |
 |
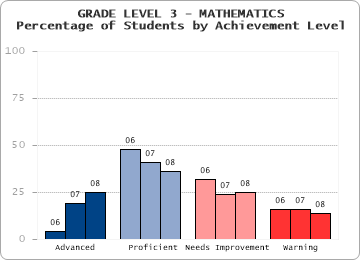
| GRADE LEVEL 3 - MATHEMATICS |
|---|
| Student Group |
State |
| Students Included |
AYP Part. |
% at Each Level |
CPI |
SGP |
Incl. in SGP (#) |
| # |
% |
A |
P |
NI |
W |
| AYP Subgroups |
| Stud. w/ Disab | 12,132 | 99 | 7 |
22 |
30 |
41 |
63.6 | N/A |
N/A |
| EL/Former EL | 7,024 | 99 | 12 |
28 |
30 |
30 |
67.0 | N/A |
N/A |
| Low-Income | 22,319 | 100 | 11 |
30 |
32 |
27 |
69.5 | N/A |
N/A |
| African American/Black | 5,542 | 100 | 10 |
27 |
33 |
30 |
66.7 | N/A |
N/A |
| Asian | 3,443 | 100 | 37 |
36 |
19 |
9 |
87.8 | N/A |
N/A |
| Hispanic/Latino | 10,108 | 99 | 11 |
28 |
31 |
30 |
67.3 | N/A |
N/A |
| Native American | 202 | 100 | 16 |
34 |
33 |
17 |
75.9 | N/A |
N/A |
| White | 49,538 | 100 | 28 |
39 |
23 |
10 |
85.7 | N/A |
N/A |
| |
| Other Student Groups |
| Male | 36,092 | 100 | 24 |
36 |
25 |
15 |
81.2 | N/A |
N/A |
| Female | 34,264 | 100 | 25 |
37 |
25 |
13 |
81.9 | N/A |
N/A |
| Title I | 23,042 | 100 | 13 |
31 |
32 |
25 |
70.7 | N/A |
N/A |
| Non-Title I | 47,314 | 100 | 30 |
39 |
21 |
9 |
86.8 | N/A |
N/A |
| Non-Low Income | 48,037 | 100 | 31 |
39 |
21 |
9 |
87.1 | N/A |
N/A |
| EL | 5,064 | 99 | 8 |
26 |
32 |
34 |
63.1 | N/A |
N/A |
| Former EL | 1,960 | 100 | 20 |
34 |
26 |
20 |
77.0 | N/A |
N/A |
| 1st Yr EL* | 529 | 99 | - |
- |
- |
- |
- | N/A |
N/A |
| Migrant | 4 | - | - | - | - | - | - | - | - |
| Native Hawaiian/ Pacific Islander | 71 | 97 | 21 |
35 |
25 |
18 |
79.2 | N/A |
N/A |
| Multi-race - Non-Hispanic/Latino | 1,452 | 99 | 25 |
32 |
26 |
17 |
80.0 | N/A |
N/A |
| |
| All Students |
| 2008 | 70,393 | 100 | 25 |
36 |
25 |
14 |
81.5 | N/A |
N/A |
| 2007 | 71,323 | 100 | 19 |
41 |
24 |
16 |
80.3 | N/A |
N/A |
 |
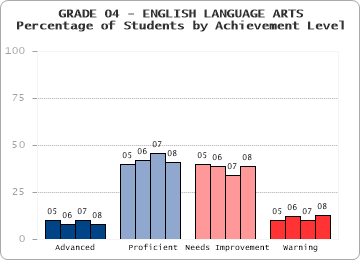
| GRADE LEVEL 4 - ENGLISH LANGUAGE ARTS |
|---|
| Student Group |
State |
| Students Included |
AYP Part. |
% at Each Level |
CPI |
SGP |
Incl. in SGP (#) |
| # |
% |
A |
P |
NI |
W |
| AYP Subgroups |
| Stud. w/ Disab | 13,134 | 99 | 1 |
13 |
44 |
42 |
56.9 | 32.0 |
11,040 |
| EL/Former EL | 6,269 | 99 | 1 |
17 |
48 |
33 |
57.4 | 45.0 |
5,198 |
| Low-Income | 22,338 | 99 | 2 |
24 |
49 |
25 |
63.9 | 40.0 |
19,321 |
| African American/Black | 5,583 | 99 | 2 |
23 |
50 |
25 |
63.1 | 39.0 |
4,842 |
| Asian | 3,495 | 99 | 13 |
43 |
34 |
10 |
80.8 | 54.0 |
3,152 |
| Hispanic/Latino | 9,716 | 99 | 2 |
21 |
48 |
29 |
61.3 | 41.0 |
8,229 |
| Native American | 190 | 99 | 2 |
31 |
51 |
16 |
70.5 | 41.0 |
176 |
| White | 50,670 | 100 | 10 |
46 |
36 |
9 |
82.2 | 50.0 |
47,717 |
| |
| Other Student Groups |
| Male | 36,579 | 99 | 5 |
37 |
42 |
16 |
74.4 | 42.0 |
33,411 |
| Female | 34,563 | 100 | 11 |
44 |
35 |
10 |
81.1 | 57.0 |
32,013 |
| Title I | 22,692 | 99 | 2 |
25 |
50 |
23 |
64.8 | 41.0 |
20,050 |
| Non-Title I | 48,450 | 99 | 11 |
48 |
33 |
8 |
83.6 | 53.0 |
45,374 |
| Non-Low Income | 48,804 | 100 | 11 |
48 |
34 |
7 |
83.9 | 53.0 |
46,103 |
| EL | 4,093 | 98 | 1 |
11 |
47 |
42 |
50.7 | 42.0 |
3,237 |
| Former EL | 2,176 | 100 | 3 |
30 |
51 |
16 |
70.0 | 47.0 |
1,961 |
| 1st Yr EL* | 456 | 91 | - |
- |
- |
- |
- | N/A |
N/A |
| Migrant | 14 | 100 | 0 |
43 |
43 |
14 |
71.4 | N/A |
12 |
| Native Hawaiian/ Pacific Islander | 72 | 99 | 10 |
40 |
40 |
10 |
81.3 | 63.0 |
53 |
| Multi-race - Non-Hispanic/Latino | 1,416 | 100 | 6 |
43 |
37 |
13 |
77.1 | 48.0 |
1,255 |
| |
| All Students |
| 2008 | 71,162 | 99 | 8 |
41 |
39 |
13 |
77.6 | 48.0 |
65,424 |
| 2007 | 70,517 | 100 | 10 |
46 |
34 |
10 |
81.2 | N/A |
N/A |
 |
| GRADE LEVEL 4 - MATHEMATICS |
|---|
| Student Group |
State |
| Students Included |
AYP Part. |
% at Each Level |
CPI |
SGP |
Incl. in SGP (#) |
| # |
% |
A |
P |
NI |
W |
| AYP Subgroups |
| Stud. w/ Disab | 13,214 | 99 | 4 |
14 |
44 |
39 |
59.9 | 39.0 |
11,093 |
| EL/Former EL | 6,318 | 100 | 9 |
19 |
44 |
29 |
62.8 | 49.0 |
5,211 |
| Low-Income | 22,447 | 100 | 8 |
21 |
47 |
24 |
66.0 | 44.0 |
19,407 |
| African American/Black | 5,608 | 100 | 7 |
19 |
48 |
26 |
63.5 | 43.0 |
4,851 |
| Asian | 3,507 | 100 | 38 |
28 |
26 |
7 |
86.1 | 62.0 |
3,159 |
| Hispanic/Latino | 9,779 | 100 | 8 |
20 |
45 |
27 |
64.1 | 47.0 |
8,255 |
| Native American | 193 | 99 | 11 |
27 |
47 |
16 |
72.3 | 46.5 |
176 |
| White | 50,848 | 100 | 23 |
33 |
36 |
9 |
81.9 | 49.0 |
47,891 |
| |
| Other Student Groups |
| Male | 36,750 | 100 | 19 |
29 |
38 |
14 |
77.6 | 48.0 |
33,564 |
| Female | 34,672 | 100 | 21 |
30 |
38 |
12 |
78.6 | 52.0 |
32,080 |
| Title I | 22,799 | 100 | 9 |
22 |
47 |
22 |
67.0 | 47.0 |
20,122 |
| Non-Title I | 48,623 | 100 | 25 |
33 |
33 |
8 |
83.3 | 49.0 |
45,522 |
| Non-Low Income | 48,975 | 100 | 25 |
33 |
34 |
8 |
83.6 | 52.0 |
46,237 |
| EL | 4,140 | 100 | 5 |
14 |
45 |
35 |
57.0 | 49.0 |
3,255 |
| Former EL | 2,178 | 100 | 16 |
27 |
41 |
16 |
73.9 | 53.0 |
1,956 |
| 1st Yr EL* | 502 | 99 | - |
- |
- |
- |
- | N/A |
N/A |
| Migrant | 14 | 100 | 0 |
57 |
29 |
14 |
76.8 | N/A |
12 |
| Native Hawaiian/ Pacific Islander | 73 | 100 | 23 |
25 |
38 |
14 |
78.8 | 55.0 |
56 |
| Multi-race - Non-Hispanic/Latino | 1,414 | 100 | 21 |
27 |
38 |
14 |
77.0 | 49.0 |
1,256 |
| |
| All Students |
| 2008 | 71,450 | 100 | 20 |
29 |
38 |
13 |
78.1 | 49.0 |
65,644 |
| 2007 | 70,645 | 100 | 19 |
29 |
39 |
13 |
77.0 | N/A |
N/A |
 |
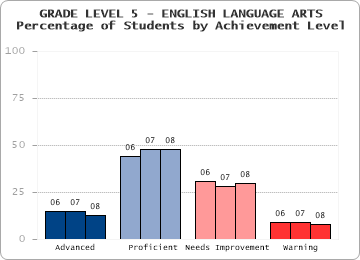
| GRADE LEVEL 5 - ENGLISH LANGUAGE ARTS |
|---|
| Student Group |
State |
| Students Included |
AYP Part. |
% at Each Level |
CPI |
SGP |
Incl. in SGP (#) |
| # |
% |
A |
P |
NI |
W |
| AYP Subgroups |
| Stud. w/ Disab | 13,403 | 99 | 2 |
21 |
47 |
30 |
64.6 | 43.0 |
11,274 |
| EL/Former EL | 5,670 | 99 | 3 |
23 |
47 |
26 |
62.9 | 47.0 |
4,658 |
| Low-Income | 21,857 | 99 | 4 |
33 |
46 |
18 |
71.2 | 44.0 |
18,977 |
| African American/Black | 5,522 | 99 | 4 |
33 |
46 |
17 |
71.1 | 44.0 |
4,767 |
| Asian | 3,366 | 100 | 22 |
46 |
25 |
7 |
87.0 | 58.0 |
3,086 |
| Hispanic/Latino | 9,293 | 99 | 3 |
29 |
47 |
21 |
67.5 | 44.0 |
7,899 |
| Native American | 207 | 100 | 3 |
41 |
44 |
12 |
76.6 | 40.0 |
183 |
| White | 50,775 | 100 | 16 |
53 |
26 |
5 |
88.1 | 52.0 |
47,794 |
| |
| Other Student Groups |
| Male | 36,352 | 99 | 10 |
47 |
33 |
10 |
82.0 | 49.0 |
33,181 |
| Female | 34,271 | 100 | 17 |
48 |
28 |
7 |
85.8 | 51.0 |
31,857 |
| Title I | 20,618 | 99 | 5 |
34 |
45 |
16 |
71.8 | 45.0 |
18,191 |
| Non-Title I | 50,005 | 100 | 17 |
54 |
24 |
5 |
88.8 | 52.0 |
46,847 |
| Non-Low Income | 48,766 | 100 | 18 |
54 |
24 |
4 |
89.5 | 53.0 |
46,061 |
| EL | 3,265 | 98 | 1 |
14 |
47 |
38 |
53.9 | 45.0 |
2,464 |
| Former EL | 2,405 | 100 | 6 |
36 |
47 |
11 |
75.2 | 51.0 |
2,194 |
| 1st Yr EL* | 458 | 92 | - |
- |
- |
- |
- | N/A |
N/A |
| Migrant | 4 | - | - | - | - | - | - | - | - |
| Native Hawaiian/ Pacific Islander | 68 | 99 | 12 |
51 |
31 |
6 |
86.0 | 54.0 |
57 |
| Multi-race - Non-Hispanic/Latino | 1,392 | 100 | 14 |
48 |
30 |
9 |
84.2 | 50.0 |
1,252 |
| |
| All Students |
| 2008 | 70,644 | 100 | 13 |
48 |
30 |
8 |
83.9 | 51.0 |
65,038 |
| 2007 | 71,320 | 100 | 15 |
48 |
28 |
9 |
84.6 | N/A |
N/A |
 |
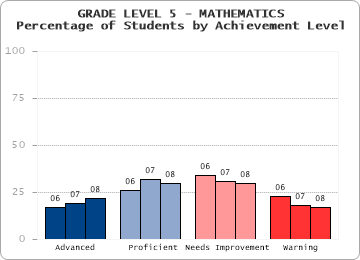
| GRADE LEVEL 5 - MATHEMATICS |
|---|
| Student Group |
State |
| Students Included |
AYP Part. |
% at Each Level |
CPI |
SGP |
Incl. in SGP (#) |
| # |
% |
A |
P |
NI |
W |
| AYP Subgroups |
| Stud. w/ Disab | 13,394 | 99 | 4 |
14 |
33 |
49 |
54.3 | 39.0 |
11,226 |
| EL/Former EL | 5,695 | 99 | 9 |
19 |
34 |
38 |
57.7 | 52.0 |
4,658 |
| Low-Income | 21,904 | 100 | 8 |
22 |
37 |
32 |
61.9 | 46.0 |
19,002 |
| African American/Black | 5,522 | 100 | 8 |
20 |
39 |
33 |
60.4 | 50.0 |
4,761 |
| Asian | 3,367 | 100 | 42 |
29 |
20 |
9 |
86.5 | 67.0 |
3,090 |
| Hispanic/Latino | 9,328 | 99 | 7 |
20 |
37 |
37 |
58.1 | 45.0 |
7,907 |
| Native American | 209 | 100 | 12 |
22 |
39 |
27 |
66.3 | 50.0 |
184 |
| White | 50,833 | 100 | 26 |
33 |
29 |
13 |
80.7 | 51.0 |
47,873 |
| |
| Other Student Groups |
| Male | 36,411 | 100 | 23 |
30 |
30 |
18 |
76.3 | 51.0 |
33,240 |
| Female | 34,311 | 100 | 22 |
30 |
31 |
17 |
76.2 | 51.0 |
31,892 |
| Title I | 20,650 | 100 | 10 |
23 |
37 |
30 |
63.1 | 48.0 |
18,196 |
| Non-Title I | 50,072 | 100 | 27 |
33 |
28 |
12 |
81.7 | 52.0 |
46,936 |
| Non-Low Income | 48,818 | 100 | 29 |
33 |
27 |
11 |
82.7 | 53.0 |
46,130 |
| EL | 3,294 | 99 | 5 |
14 |
31 |
50 |
49.5 | 51.0 |
2,471 |
| Former EL | 2,401 | 99 | 14 |
26 |
37 |
23 |
69.0 | 54.0 |
2,187 |
| 1st Yr EL* | 522 | 100 | - |
- |
- |
- |
- | N/A |
N/A |
| Migrant | 4 | - | - | - | - | - | - | - | - |
| Native Hawaiian/ Pacific Islander | 68 | 99 | 21 |
37 |
31 |
12 |
83.1 | 50.5 |
58 |
| Multi-race - Non-Hispanic/Latino | 1,395 | 100 | 23 |
30 |
28 |
20 |
75.8 | 50.0 |
1,259 |
| |
| All Students |
| 2008 | 70,748 | 100 | 22 |
30 |
30 |
17 |
76.2 | 51.0 |
65,132 |
| 2007 | 71,352 | 100 | 19 |
32 |
31 |
18 |
75.7 | N/A |
N/A |
 |
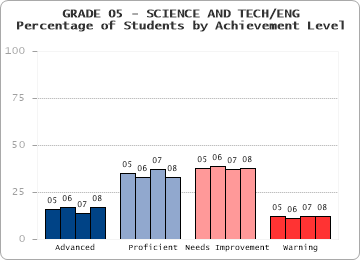
| GRADE LEVEL 5 - SCIENCE AND TECHNOLOGY/ENGINEERING |
|---|
| Student Group |
State |
| Students Included |
AYP Part. |
% at Each Level |
CPI |
SGP |
Incl. in SGP (#) |
| # |
% |
A |
P |
NI |
W |
| AYP Subgroups |
| Stud. w/ Disab | 13,369 | 99 | 4 |
17 |
45 |
33 |
61.9 | N/A |
N/A |
| EL/Former EL | 5,686 | 99 | 3 |
13 |
46 |
38 |
53.1 | N/A |
N/A |
| Low-Income | 21,873 | 99 | 4 |
19 |
50 |
26 |
61.6 | N/A |
N/A |
| African American/Black | 5,515 | 100 | 3 |
16 |
50 |
31 |
57.8 | N/A |
N/A |
| Asian | 3,363 | 100 | 25 |
31 |
34 |
10 |
80.4 | N/A |
N/A |
| Hispanic/Latino | 9,315 | 99 | 4 |
15 |
50 |
31 |
57.4 | N/A |
N/A |
| Native American | 209 | 100 | 6 |
28 |
49 |
17 |
69.6 | N/A |
N/A |
| White | 50,800 | 100 | 20 |
38 |
35 |
7 |
83.3 | N/A |
N/A |
| |
| Other Student Groups |
| Male | 36,377 | 100 | 17 |
34 |
37 |
12 |
78.6 | N/A |
N/A |
| Female | 34,286 | 100 | 16 |
32 |
39 |
13 |
76.5 | N/A |
N/A |
| Title I | 20,634 | 100 | 5 |
20 |
50 |
25 |
61.8 | N/A |
N/A |
| Non-Title I | 50,029 | 100 | 22 |
38 |
33 |
7 |
84.1 | N/A |
N/A |
| Non-Low Income | 48,790 | 100 | 22 |
39 |
32 |
6 |
84.8 | N/A |
N/A |
| EL | 3,289 | 99 | 1 |
8 |
41 |
50 |
45.8 | N/A |
N/A |
| Former EL | 2,397 | 99 | 5 |
20 |
54 |
22 |
63.0 | N/A |
N/A |
| 1st Yr EL* | 521 | 98 | - |
- |
- |
- |
- | N/A |
N/A |
| Migrant | 4 | - | - | - | - | - | - | - | - |
| Native Hawaiian/ Pacific Islander | 68 | 99 | 22 |
34 |
32 |
12 |
81.6 | N/A |
N/A |
| Multi-race - Non-Hispanic/Latino | 1,393 | 100 | 17 |
33 |
37 |
13 |
77.7 | N/A |
N/A |
| |
| All Students |
| 2008 | 70,689 | 100 | 17 |
33 |
38 |
12 |
77.6 | N/A |
N/A |
| 2007 | 71,338 | 100 | 14 |
37 |
37 |
12 |
78.9 | N/A |
N/A |
 |
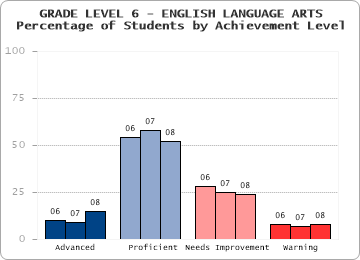
| GRADE LEVEL 6 - ENGLISH LANGUAGE ARTS |
|---|
| Student Group |
State |
| Students Included |
AYP Part. |
% at Each Level |
CPI |
SGP |
Incl. in SGP (#) |
| # |
% |
A |
P |
NI |
W |
| AYP Subgroups |
| Stud. w/ Disab | 13,444 | 99 | 2 |
26 |
42 |
31 |
66.2 | 39.0 |
11,165 |
| EL/Former EL | 5,067 | 98 | 3 |
28 |
41 |
28 |
64.3 | 51.0 |
4,083 |
| Low-Income | 22,143 | 99 | 4 |
40 |
38 |
17 |
74.5 | 46.0 |
18,959 |
| African American/Black | 5,740 | 99 | 5 |
42 |
37 |
16 |
75.8 | 49.0 |
4,840 |
| Asian | 3,459 | 100 | 29 |
49 |
17 |
5 |
90.5 | 63.0 |
3,148 |
| Hispanic/Latino | 9,488 | 99 | 4 |
36 |
39 |
21 |
71.0 | 46.0 |
7,902 |
| Native American | 199 | 99 | 12 |
52 |
28 |
9 |
84.5 | 52.0 |
176 |
| White | 51,315 | 100 | 17 |
57 |
20 |
5 |
89.9 | 50.0 |
48,247 |
| |
| Other Student Groups |
| Male | 37,002 | 99 | 10 |
52 |
27 |
11 |
83.6 | 47.0 |
33,604 |
| Female | 34,536 | 99 | 20 |
53 |
21 |
6 |
89.0 | 53.0 |
31,890 |
| Title I | 19,939 | 99 | 5 |
41 |
37 |
16 |
75.2 | 47.0 |
17,305 |
| Non-Title I | 51,599 | 100 | 19 |
57 |
19 |
5 |
90.4 | 51.0 |
48,189 |
| Non-Low Income | 49,395 | 100 | 20 |
58 |
18 |
4 |
91.4 | 52.0 |
46,535 |
| EL | 2,826 | 97 | 1 |
15 |
42 |
41 |
53.4 | 47.0 |
2,050 |
| Former EL | 2,241 | 100 | 5 |
45 |
38 |
11 |
78.2 | 54.0 |
2,033 |
| 1st Yr EL* | 404 | 96 | - |
- |
- |
- |
- | N/A |
N/A |
| Migrant | 7 | - | - | - | - | - | - | - | - |
| Native Hawaiian/ Pacific Islander | 103 | 97 | 15 |
41 |
27 |
17 |
78.9 | 57.0 |
85 |
| Multi-race - Non-Hispanic/Latino | 1,234 | 99 | 15 |
50 |
28 |
7 |
85.4 | 50.0 |
1,096 |
| |
| All Students |
| 2008 | 71,575 | 99 | 15 |
52 |
24 |
8 |
86.2 | 50.0 |
65,494 |
| 2007 | 72,887 | 100 | 9 |
58 |
25 |
7 |
86.4 | N/A |
N/A |
 |
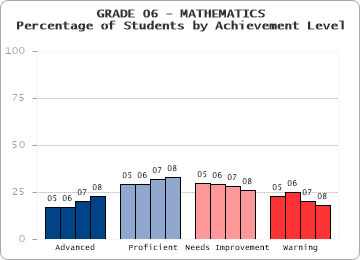
| GRADE LEVEL 6 - MATHEMATICS |
|---|
| Student Group |
State |
| Students Included |
AYP Part. |
% at Each Level |
CPI |
SGP |
Incl. in SGP (#) |
| # |
% |
A |
P |
NI |
W |
| AYP Subgroups |
| Stud. w/ Disab | 13,438 | 99 | 4 |
14 |
29 |
53 |
53.6 | 39.0 |
11,092 |
| EL/Former EL | 5,121 | 99 | 8 |
20 |
28 |
44 |
56.6 | 49.0 |
4,086 |
| Low-Income | 22,174 | 99 | 9 |
24 |
32 |
35 |
62.6 | 44.0 |
18,944 |
| African American/Black | 5,751 | 99 | 7 |
23 |
33 |
37 |
60.9 | 45.0 |
4,824 |
| Asian | 3,463 | 100 | 45 |
31 |
15 |
9 |
88.7 | 60.0 |
3,155 |
| Hispanic/Latino | 9,523 | 99 | 8 |
22 |
31 |
40 |
59.2 | 45.0 |
7,904 |
| Native American | 198 | 99 | 16 |
30 |
31 |
23 |
72.7 | 47.5 |
174 |
| White | 51,361 | 100 | 27 |
36 |
24 |
13 |
82.3 | 50.0 |
48,251 |
| |
| Other Student Groups |
| Male | 37,032 | 99 | 23 |
32 |
25 |
20 |
77.1 | 47.0 |
33,601 |
| Female | 34,602 | 100 | 24 |
33 |
26 |
17 |
78.1 | 53.0 |
31,888 |
| Title I | 19,969 | 99 | 11 |
25 |
31 |
33 |
63.9 | 46.0 |
17,285 |
| Non-Title I | 51,665 | 100 | 28 |
36 |
23 |
13 |
82.9 | 51.0 |
48,204 |
| Non-Low Income | 49,460 | 100 | 30 |
36 |
23 |
11 |
84.3 | 52.0 |
46,545 |
| EL | 2,881 | 99 | 4 |
13 |
26 |
57 |
47.1 | 47.0 |
2,054 |
| Former EL | 2,240 | 100 | 14 |
28 |
31 |
27 |
68.8 | 51.0 |
2,032 |
| 1st Yr EL* | 447 | 99 | - |
- |
- |
- |
- | N/A |
N/A |
| Migrant | 7 | - | - | - | - | - | - | - | - |
| Native Hawaiian/ Pacific Islander | 104 | 98 | 18 |
26 |
19 |
37 |
66.6 | 48.5 |
88 |
| Multi-race - Non-Hispanic/Latino | 1,234 | 99 | 24 |
30 |
26 |
20 |
75.6 | 51.0 |
1,093 |
| |
| All Students |
| 2008 | 71,679 | 100 | 23 |
33 |
26 |
18 |
77.6 | 50.0 |
65,489 |
| 2007 | 72,889 | 100 | 20 |
32 |
28 |
20 |
75.5 | N/A |
N/A |
 |
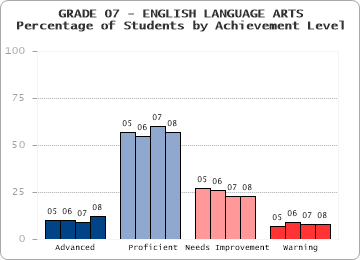
| GRADE LEVEL 7 - ENGLISH LANGUAGE ARTS |
|---|
| Student Group |
State |
| Students Included |
AYP Part. |
% at Each Level |
CPI |
SGP |
Incl. in SGP (#) |
| # |
% |
A |
P |
NI |
W |
| AYP Subgroups |
| Stud. w/ Disab | 13,544 | 97 | 1 |
26 |
43 |
29 |
67.2 | 40.0 |
11,284 |
| EL/Former EL | 4,061 | 98 | 2 |
27 |
40 |
31 |
63.0 | 55.0 |
3,085 |
| Low-Income | 22,476 | 98 | 3 |
43 |
38 |
16 |
75.9 | 47.0 |
19,104 |
| African American/Black | 6,079 | 98 | 3 |
44 |
36 |
16 |
76.6 | 48.0 |
5,069 |
| Asian | 3,385 | 99 | 23 |
55 |
18 |
4 |
91.2 | 62.0 |
3,086 |
| Hispanic/Latino | 9,591 | 98 | 3 |
39 |
39 |
19 |
73.0 | 48.0 |
7,868 |
| Native American | 218 | 99 | 5 |
46 |
38 |
11 |
78.4 | 43.0 |
192 |
| White | 52,132 | 99 | 15 |
62 |
19 |
5 |
91.0 | 50.0 |
48,871 |
| |
| Other Student Groups |
| Male | 37,458 | 99 | 8 |
54 |
28 |
10 |
83.8 | 43.0 |
33,774 |
| Female | 35,302 | 99 | 18 |
59 |
18 |
5 |
91.1 | 56.0 |
32,519 |
| Title I | 17,412 | 98 | 3 |
44 |
38 |
15 |
76.5 | 47.0 |
14,944 |
| Non-Title I | 55,348 | 99 | 15 |
61 |
19 |
5 |
90.8 | 51.0 |
51,349 |
| Non-Low Income | 50,284 | 99 | 17 |
63 |
17 |
4 |
92.5 | 51.0 |
47,189 |
| EL | 2,461 | 97 | 0 |
15 |
42 |
43 |
53.2 | 51.0 |
1,701 |
| Former EL | 1,600 | 99 | 4 |
45 |
38 |
13 |
78.1 | 60.0 |
1,384 |
| 1st Yr EL* | 493 | 96 | - |
- |
- |
- |
- | N/A |
N/A |
| Migrant | 9 | - | - | - | - | - | - | - | - |
| Native Hawaiian/ Pacific Islander | 75 | 99 | 8 |
47 |
35 |
11 |
82.7 | 62.0 |
64 |
| Multi-race - Non-Hispanic/Latino | 1,280 | 99 | 14 |
54 |
25 |
8 |
87.0 | 46.0 |
1,143 |
| |
| All Students |
| 2008 | 72,799 | 99 | 12 |
57 |
23 |
8 |
87.3 | 50.0 |
66,293 |
| 2007 | 73,577 | 100 | 9 |
60 |
23 |
8 |
86.9 | N/A |
N/A |
 |
| GRADE LEVEL 7 - MATHEMATICS |
|---|
| Student Group |
State |
| Students Included |
AYP Part. |
% at Each Level |
CPI |
SGP |
Incl. in SGP (#) |
| # |
% |
A |
P |
NI |
W |
| AYP Subgroups |
| Stud. w/ Disab | 13,669 | 98 | 2 |
10 |
26 |
62 |
46.5 | 42.0 |
11,285 |
| EL/Former EL | 4,138 | 99 | 4 |
13 |
25 |
59 |
45.4 | 47.0 |
3,130 |
| Low-Income | 22,664 | 99 | 4 |
19 |
32 |
45 |
54.2 | 44.0 |
19,223 |
| African American/Black | 6,138 | 99 | 3 |
18 |
32 |
47 |
52.3 | 44.0 |
5,094 |
| Asian | 3,398 | 100 | 32 |
35 |
21 |
12 |
83.8 | 57.0 |
3,092 |
| Hispanic/Latino | 9,684 | 99 | 3 |
16 |
29 |
51 |
50.2 | 42.0 |
7,922 |
| Native American | 219 | 99 | 5 |
22 |
35 |
37 |
58.3 | 41.0 |
193 |
| White | 52,320 | 100 | 17 |
37 |
29 |
17 |
77.5 | 51.0 |
48,977 |
| |
| Other Student Groups |
| Male | 37,676 | 99 | 15 |
32 |
27 |
25 |
71.5 | 49.0 |
33,880 |
| Female | 35,446 | 100 | 15 |
33 |
30 |
23 |
72.2 | 51.0 |
32,603 |
| Title I | 17,564 | 99 | 5 |
20 |
32 |
43 |
55.3 | 46.0 |
15,051 |
| Non-Title I | 55,558 | 99 | 18 |
36 |
28 |
18 |
77.1 | 51.0 |
51,432 |
| Non-Low Income | 50,458 | 100 | 20 |
38 |
27 |
15 |
79.8 | 52.0 |
47,260 |
| EL | 2,526 | 99 | 2 |
8 |
20 |
70 |
38.0 | 45.0 |
1,733 |
| Former EL | 1,612 | 99 | 6 |
21 |
31 |
42 |
56.9 | 49.0 |
1,397 |
| 1st Yr EL* | 559 | 99 | - |
- |
- |
- |
- | N/A |
N/A |
| Migrant | 9 | - | - | - | - | - | - | - | - |
| Native Hawaiian/ Pacific Islander | 75 | 99 | 9 |
33 |
29 |
28 |
69.0 | 61.0 |
63 |
| Multi-race - Non-Hispanic/Latino | 1,288 | 100 | 16 |
29 |
30 |
25 |
70.8 | 51.0 |
1,142 |
| |
| All Students |
| 2008 | 73,169 | 99 | 15 |
32 |
29 |
24 |
71.8 | 50.0 |
66,483 |
| 2007 | 73,592 | 100 | 15 |
31 |
30 |
24 |
70.4 | N/A |
N/A |
 |
| GRADE LEVEL 8 - ENGLISH LANGUAGE ARTS |
|---|
| Student Group |
State |
| Students Included |
AYP Part. |
% at Each Level |
CPI |
SGP |
Incl. in SGP (#) |
| # |
% |
A |
P |
NI |
W |
| AYP Subgroups |
| Stud. w/ Disab | 13,027 | 97 | 1 |
35 |
36 |
27 |
70.3 | 44.0 |
10,919 |
| EL/Former EL | 3,840 | 98 | 2 |
30 |
34 |
34 |
62.3 | 51.0 |
2,924 |
| Low-Income | 22,189 | 98 | 3 |
51 |
31 |
15 |
78.8 | 47.0 |
19,150 |
| African American/Black | 6,023 | 98 | 4 |
54 |
29 |
13 |
80.6 | 49.0 |
5,209 |
| Asian | 3,355 | 99 | 22 |
59 |
13 |
5 |
92.1 | 55.0 |
3,091 |
| Hispanic/Latino | 9,462 | 98 | 3 |
47 |
32 |
18 |
75.7 | 48.0 |
7,898 |
| Native American | 212 | 99 | 8 |
55 |
29 |
8 |
84.3 | 43.0 |
185 |
| White | 52,986 | 99 | 14 |
67 |
14 |
4 |
92.5 | 49.0 |
50,104 |
| |
| Other Student Groups |
| Male | 37,806 | 99 | 8 |
63 |
20 |
9 |
87.3 | 48.0 |
34,538 |
| Female | 35,421 | 99 | 17 |
63 |
15 |
5 |
91.4 | 50.0 |
33,000 |
| Title I | 16,968 | 98 | 4 |
53 |
30 |
14 |
79.6 | 48.0 |
14,862 |
| Non-Title I | 56,259 | 99 | 15 |
66 |
14 |
5 |
92.2 | 50.0 |
52,676 |
| Non-Low Income | 51,038 | 99 | 16 |
68 |
12 |
4 |
93.8 | 50.0 |
48,388 |
| EL | 2,385 | 97 | 1 |
18 |
36 |
46 |
52.4 | 49.0 |
1,634 |
| Former EL | 1,455 | 99 | 4 |
51 |
32 |
14 |
78.7 | 54.0 |
1,290 |
| 1st Yr EL* | 426 | 96 | - |
- |
- |
- |
- | N/A |
N/A |
| Migrant | 6 | - | - | - | - | - | - | - | - |
| Native Hawaiian/ Pacific Islander | 65 | 96 | 9 |
51 |
32 |
8 |
85.4 | 48.0 |
53 |
| Multi-race - Non-Hispanic/Latino | 1,124 | 99 | 11 |
63 |
19 |
7 |
88.7 | 47.0 |
998 |
| |
| All Students |
| 2008 | 73,268 | 99 | 12 |
63 |
18 |
7 |
89.3 | 49.0 |
67,539 |
| 2007 | 74,433 | 100 | 12 |
63 |
18 |
6 |
89.5 | N/A |
N/A |
 |
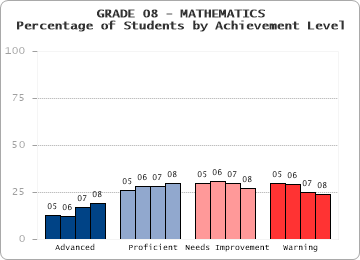
| GRADE LEVEL 8 - MATHEMATICS |
|---|
| Student Group |
State |
| Students Included |
AYP Part. |
% at Each Level |
CPI |
SGP |
Incl. in SGP (#) |
| # |
% |
A |
P |
NI |
W |
| AYP Subgroups |
| Stud. w/ Disab | 13,047 | 97 | 2 |
10 |
26 |
63 |
45.8 | 42.0 |
10,841 |
| EL/Former EL | 3,891 | 99 | 5 |
12 |
23 |
60 |
44.3 | 49.0 |
2,940 |
| Low-Income | 22,243 | 98 | 6 |
19 |
30 |
45 |
54.6 | 47.0 |
19,169 |
| African American/Black | 6,029 | 98 | 5 |
19 |
31 |
46 |
53.4 | 48.0 |
5,203 |
| Asian | 3,356 | 99 | 39 |
29 |
18 |
13 |
83.7 | 59.0 |
3,093 |
| Hispanic/Latino | 9,524 | 98 | 5 |
17 |
28 |
50 |
51.2 | 47.0 |
7,911 |
| Native American | 209 | 99 | 11 |
25 |
25 |
39 |
62.3 | 45.0 |
183 |
| White | 53,017 | 99 | 22 |
34 |
27 |
17 |
77.3 | 51.0 |
50,081 |
| |
| Other Student Groups |
| Male | 37,832 | 99 | 19 |
30 |
26 |
24 |
72.1 | 50.0 |
34,506 |
| Female | 35,492 | 99 | 19 |
30 |
27 |
23 |
72.0 | 51.0 |
33,024 |
| Title I | 17,028 | 99 | 7 |
21 |
30 |
43 |
55.7 | 49.0 |
14,899 |
| Non-Title I | 56,296 | 99 | 23 |
33 |
26 |
18 |
77.0 | 51.0 |
52,631 |
| Non-Low Income | 51,081 | 99 | 25 |
35 |
25 |
15 |
79.7 | 52.0 |
48,361 |
| EL | 2,433 | 99 | 3 |
7 |
19 |
71 |
36.6 | 44.0 |
1,655 |
| Former EL | 1,458 | 99 | 9 |
21 |
28 |
42 |
57.2 | 53.0 |
1,285 |
| 1st Yr EL* | 475 | 100 | - |
- |
- |
- |
- | N/A |
N/A |
| Migrant | 6 | - | - | - | - | - | - | - | - |
| Native Hawaiian/ Pacific Islander | 64 | 96 | 19 |
20 |
34 |
27 |
67.6 | 54.0 |
53 |
| Multi-race - Non-Hispanic/Latino | 1,125 | 99 | 19 |
27 |
28 |
26 |
69.4 | 49.0 |
1,006 |
| |
| All Students |
| 2008 | 73,365 | 99 | 19 |
30 |
27 |
24 |
72.0 | 51.0 |
67,531 |
| 2007 | 74,319 | 100 | 17 |
28 |
30 |
25 |
70.2 | N/A |
N/A |
 |
| GRADE LEVEL 8 - SCIENCE AND TECHNOLOGY/ENGINEERING |
|---|
| Student Group |
State |
| Students Included |
AYP Part. |
% at Each Level |
CPI |
SGP |
Incl. in SGP (#) |
| # |
% |
A |
P |
NI |
W |
| AYP Subgroups |
| Stud. w/ Disab | 12,972 | 97 | 0 |
10 |
37 |
53 |
48.6 | N/A |
N/A |
| EL/Former EL | 3,879 | 98 | 0 |
7 |
27 |
66 |
37.1 | N/A |
N/A |
| Low-Income | 22,139 | 98 | 0 |
14 |
41 |
45 |
49.9 | N/A |
N/A |
| African American/Black | 6,003 | 98 | 0 |
11 |
40 |
48 |
47.5 | N/A |
N/A |
| Asian | 3,358 | 99 | 5 |
44 |
34 |
18 |
74.3 | N/A |
N/A |
| Hispanic/Latino | 9,470 | 98 | 0 |
11 |
37 |
52 |
45.2 | N/A |
N/A |
| Native American | 208 | 99 | 1 |
27 |
42 |
30 |
63.0 | N/A |
N/A |
| White | 52,940 | 99 | 3 |
44 |
40 |
13 |
75.6 | N/A |
N/A |
| |
| Other Student Groups |
| Male | 37,739 | 99 | 3 |
38 |
38 |
21 |
70.3 | N/A |
N/A |
| Female | 35,424 | 99 | 2 |
35 |
41 |
22 |
67.9 | N/A |
N/A |
| Title I | 16,933 | 98 | 0 |
14 |
41 |
45 |
49.4 | N/A |
N/A |
| Non-Title I | 56,230 | 99 | 3 |
43 |
39 |
15 |
75.1 | N/A |
N/A |
| Non-Low Income | 51,024 | 99 | 3 |
46 |
38 |
12 |
77.4 | N/A |
N/A |
| EL | 2,431 | 98 | 0 |
3 |
20 |
78 |
30.4 | N/A |
N/A |
| Former EL | 1,448 | 98 | 0 |
14 |
39 |
47 |
48.2 | N/A |
N/A |
| 1st Yr EL* | 476 | 99 | - |
- |
- |
- |
- | N/A |
N/A |
| Migrant | 6 | - | - | - | - | - | - | - | - |
| Native Hawaiian/ Pacific Islander | 63 | 94 | 2 |
30 |
46 |
22 |
63.5 | N/A |
N/A |
| Multi-race - Non-Hispanic/Latino | 1,121 | 99 | 3 |
32 |
42 |
23 |
66.1 | N/A |
N/A |
| |
| All Students |
| 2008 | 73,203 | 99 | 3 |
36 |
39 |
22 |
69.1 | N/A |
N/A |
| 2007 | 74,257 | 99 | 3 |
30 |
44 |
24 |
65.9 | N/A |
N/A |
 |
| GRADE LEVEL 10 - ENGLISH LANGUAGE ARTS |
|---|
| Student Group |
State |
| Students Included |
AYP Part. |
% at Each Level |
CPI |
SGP |
Incl. in SGP (#) |
| # |
% |
A |
P |
NI |
F |
| AYP Subgroups |
| Stud. w/ Disab | 11,433 | 94 | 3 |
32 |
46 |
20 |
73.1 | N/A |
N/A |
| EL/Former EL | 3,325 | 94 | 4 |
24 |
49 |
23 |
64.7 | N/A |
N/A |
| Low-Income | 18,676 | 96 | 8 |
45 |
37 |
9 |
81.2 | N/A |
N/A |
| African American/Black | 6,002 | 96 | 8 |
47 |
36 |
9 |
82.3 | N/A |
N/A |
| Asian | 3,274 | 98 | 33 |
44 |
19 |
4 |
91.2 | N/A |
N/A |
| Hispanic/Latino | 8,471 | 95 | 7 |
42 |
40 |
11 |
78.3 | N/A |
N/A |
| Native American | 205 | 96 | 15 |
54 |
29 |
2 |
87.6 | N/A |
N/A |
| White | 52,316 | 98 | 27 |
53 |
17 |
3 |
93.1 | N/A |
N/A |
| |
| Other Student Groups |
| Male | 36,139 | 97 | 18 |
52 |
25 |
5 |
88.4 | N/A |
N/A |
| Female | 35,295 | 98 | 29 |
50 |
18 |
3 |
92.2 | N/A |
N/A |
| Title I | 9,308 | 96 | 7 |
44 |
40 |
9 |
79.6 | N/A |
N/A |
| Non-Title I | 62,126 | 98 | 26 |
52 |
18 |
4 |
91.9 | N/A |
N/A |
| Non-Low Income | 52,758 | 98 | 29 |
53 |
15 |
3 |
93.5 | N/A |
N/A |
| EL | 2,092 | 93 | 2 |
15 |
52 |
32 |
56.4 | N/A |
N/A |
| Former EL | 1,233 | 97 | 6 |
41 |
44 |
9 |
78.8 | N/A |
N/A |
| 1st Yr EL* | 376 | 94 | - |
- |
- |
- |
- | N/A |
N/A |
| Migrant | 5 | - | - | - | - | - | - | - | - |
| Native Hawaiian/ Pacific Islander | 108 | 97 | 20 |
44 |
26 |
9 |
85.9 | N/A |
N/A |
| Multi-race - Non-Hispanic/Latino | 1,058 | 98 | 21 |
51 |
24 |
5 |
89.6 | N/A |
N/A |
| |
| All Students |
| 2008 | 71,510 | 98 | 23 |
51 |
21 |
4 |
90.3 | N/A |
N/A |
| 2007 | 72,471 | 99 | 22 |
49 |
24 |
6 |
87.9 | N/A |
N/A |
 |
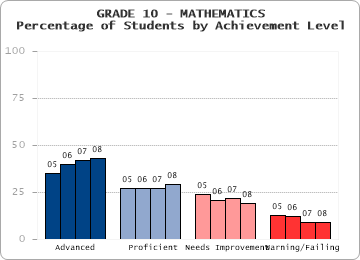
| GRADE LEVEL 10 - MATHEMATICS |
|---|
| Student Group |
State |
| Students Included |
AYP Part. |
% at Each Level |
CPI |
SGP |
Incl. in SGP (#) |
| # |
% |
A |
P |
NI |
F |
| AYP Subgroups |
| Stud. w/ Disab | 11,341 | 94 | 9 |
24 |
35 |
32 |
65.9 | N/A |
N/A |
| EL/Former EL | 3,325 | 95 | 18 |
21 |
31 |
30 |
65.5 | N/A |
N/A |
| Low-Income | 18,468 | 96 | 22 |
29 |
30 |
18 |
75.2 | N/A |
N/A |
| African American/Black | 5,946 | 95 | 20 |
28 |
33 |
19 |
73.3 | N/A |
N/A |
| Asian | 3,279 | 99 | 65 |
20 |
11 |
4 |
93.3 | N/A |
N/A |
| Hispanic/Latino | 8,381 | 94 | 19 |
27 |
32 |
23 |
71.3 | N/A |
N/A |
| Native American | 204 | 95 | 31 |
34 |
24 |
11 |
82.0 | N/A |
N/A |
| White | 52,120 | 98 | 48 |
30 |
16 |
6 |
90.3 | N/A |
N/A |
| |
| Other Student Groups |
| Male | 35,989 | 97 | 44 |
28 |
19 |
10 |
86.6 | N/A |
N/A |
| Female | 35,093 | 98 | 42 |
29 |
20 |
8 |
86.9 | N/A |
N/A |
| Title I | 9,191 | 95 | 22 |
29 |
31 |
18 |
74.7 | N/A |
N/A |
| Non-Title I | 61,891 | 98 | 46 |
29 |
18 |
7 |
88.5 | N/A |
N/A |
| Non-Low Income | 52,614 | 98 | 50 |
28 |
16 |
5 |
90.7 | N/A |
N/A |
| EL | 2,106 | 95 | 14 |
17 |
32 |
37 |
59.4 | N/A |
N/A |
| Former EL | 1,219 | 96 | 26 |
27 |
30 |
17 |
75.9 | N/A |
N/A |
| 1st Yr EL* | 397 | 99 | - |
- |
- |
- |
- | N/A |
N/A |
| Migrant | 4 | - | - | - | - | - | - | - | - |
| Native Hawaiian/ Pacific Islander | 107 | 96 | 41 |
21 |
21 |
17 |
79.9 | N/A |
N/A |
| Multi-race - Non-Hispanic/Latino | 1,045 | 97 | 39 |
29 |
23 |
9 |
85.8 | N/A |
N/A |
| |
| All Students |
| 2008 | 71,166 | 97 | 43 |
29 |
19 |
9 |
86.7 | N/A |
N/A |
| 2007 | 71,692 | 99 | 42 |
27 |
22 |
9 |
85.0 | N/A |
N/A |
 |
| GRADE LEVEL 10 - SCIENCE AND TECHNOLOGY/ENGINEERING |
|---|
| Student Group |
State |
| Students Included |
AYP Part. |
% at Each Level |
CPI |
SGP |
Incl. in SGP (#) |
| # |
% |
A |
P |
NI |
F |
| AYP Subgroups |
| Stud. w/ Disab | 10,787 | 93 | 2 |
19 |
43 |
37 |
58.6 | N/A |
N/A |
| EL/Former EL | 2,872 | 94 | 3 |
17 |
36 |
44 |
52.2 | N/A |
N/A |
| Low-Income | 17,572 | 95 | 3 |
28 |
44 |
26 |
64.0 | N/A |
N/A |
| African American/Black | 5,509 | 95 | 3 |
25 |
45 |
27 |
62.1 | N/A |
N/A |
| Asian | 3,078 | 99 | 29 |
39 |
24 |
8 |
85.4 | N/A |
N/A |
| Hispanic/Latino | 7,877 | 95 | 2 |
22 |
43 |
32 |
58.7 | N/A |
N/A |
| Native American | 200 | 97 | 7 |
39 |
41 |
13 |
74.0 | N/A |
N/A |
| White | 50,623 | 98 | 16 |
49 |
28 |
7 |
84.8 | N/A |
N/A |
| |
| Other Student Groups |
| Male | 34,591 | 97 | 14 |
43 |
30 |
12 |
80.1 | N/A |
N/A |
| Female | 33,767 | 98 | 14 |
43 |
33 |
11 |
79.6 | N/A |
N/A |
| Title I | 8,721 | 95 | 2 |
22 |
49 |
28 |
59.5 | N/A |
N/A |
| Non-Title I | 59,637 | 98 | 16 |
46 |
29 |
9 |
82.8 | N/A |
N/A |
| Non-Low Income | 50,786 | 98 | 18 |
48 |
27 |
7 |
85.3 | N/A |
N/A |
| EL | 1,676 | 93 | 1 |
11 |
31 |
56 |
44.0 | N/A |
N/A |
| Former EL | 1,196 | 96 | 5 |
26 |
42 |
27 |
63.6 | N/A |
N/A |
| 1st Yr EL* | | - | - | - | - | - | - | - | - |
| Migrant | 4 | - | - | - | - | - | - | - | - |
| Native Hawaiian/ Pacific Islander | 87 | 98 | 11 |
32 |
40 |
16 |
73.3 | N/A |
N/A |
| Multi-race - Non-Hispanic/Latino | 984 | 97 | 15 |
39 |
34 |
13 |
78.5 | N/A |
N/A |
| |
| All Students |
| 2008 | 68,358 | 97 | 14 |
43 |
31 |
12 |
79.8 | N/A |
N/A |
| 2007 | | - | - | - | - | - | - | - | - |
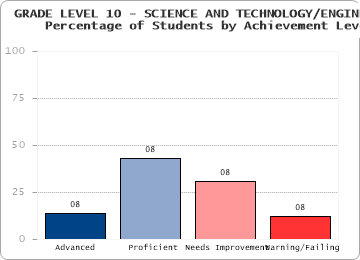 |
| * Note: Grade 10 Science and Technology/Engineering results represent the highest achievement level attained by students by the end of grade 10. In addition, only students enrolled for two full years in the state/district/school are included in state/district/school achievement level results. |
| ALL GRADES - ENGLISH LANGUAGE ARTS |
|---|
| Student Group |
State |
| Students Included |
AYP Part. |
% at Each Level |
CPI |
SGP |
Incl. in SGP (#) |
| # |
% |
A |
P |
NI |
W |
| AYP Subgroups |
| Stud. w/ Disab | 90,105 | 98 | 2 |
25 |
43 |
31 |
65.9 | 39.0 |
55,682 |
| EL/Former EL | 35,225 | 98 | 3 |
24 |
44 |
30 |
62.2 | 49.0 |
19,948 |
| Low-Income | 151,971 | 99 | 4 |
37 |
41 |
18 |
73.2 | 45.0 |
95,511 |
| African American/Black | 40,491 | 98 | 4 |
39 |
40 |
17 |
74.2 | 46.0 |
24,727 |
| Asian | 23,765 | 99 | 23 |
48 |
22 |
6 |
88.1 | 59.0 |
15,563 |
| Hispanic/Latino | 66,099 | 98 | 4 |
34 |
41 |
21 |
70.2 | 46.0 |
39,796 |
| Native American | 1,436 | 99 | 8 |
45 |
38 |
10 |
79.8 | 44.0 |
912 |
| White | 359,691 | 99 | 17 |
55 |
23 |
5 |
89.1 | 50.0 |
242,733 |
| |
| Other Student Groups |
| Male | 257,372 | 99 | 10 |
49 |
30 |
11 |
82.8 | 47.0 |
168,508 |
| Female | 243,620 | 99 | 19 |
51 |
24 |
6 |
87.8 | 53.0 |
161,279 |
| Title I | 129,967 | 99 | 4 |
37 |
41 |
17 |
72.9 | 46.0 |
85,352 |
| Non-Title I | 371,025 | 99 | 18 |
55 |
22 |
5 |
89.5 | 51.0 |
244,435 |
| Non-Low Income | 349,021 | 99 | 19 |
56 |
21 |
5 |
90.4 | 52.0 |
234,276 |
| EL | 22,153 | 97 | 1 |
15 |
44 |
39 |
54.1 | 46.0 |
11,086 |
| Former EL | 13,072 | 99 | 5 |
39 |
43 |
13 |
75.8 | 53.0 |
8,862 |
| 1st Yr EL* | | - | - | - | - | - | - | - | - |
| Migrant | 50 | 100 | 2 |
32 |
44 |
22 |
64.0 | 41.0 |
33 |
| Native Hawaiian/ Pacific Islander | 560 | 98 | 13 |
45 |
33 |
10 |
83.1 | 57.0 |
312 |
| Multi-race - Non-Hispanic/Latino | 8,950 | 99 | 13 |
49 |
29 |
9 |
84.3 | 48.0 |
5,744 |
| |
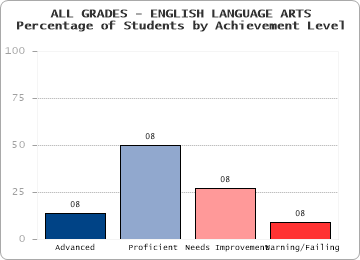
| All Students |
| 2008 | 501,261 | 99 | 14 |
50 |
27 |
9 |
85.2 | 50.0 |
329,788 |
| 2007 | | - | - | - | - | - | - | - | - |
 |
| ALL GRADES - MATHEMATICS |
|---|
| Student Group |
State |
| Students Included |
AYP Part. |
% at Each Level |
CPI |
SGP |
Incl. in SGP (#) |
| # |
% |
A |
P |
NI |
W |
| AYP Subgroups |
| Stud. w/ Disab | 90,238 | 98 | 4 |
15 |
32 |
49 |
55.4 | 40.0 |
55,537 |
| EL/Former EL | 35,511 | 99 | 9 |
20 |
31 |
40 |
58.1 | 49.0 |
20,025 |
| Low-Income | 152,222 | 99 | 10 |
23 |
34 |
33 |
63.1 | 45.0 |
95,745 |
| African American/Black | 40,536 | 99 | 8 |
22 |
35 |
34 |
61.4 | 46.0 |
24,733 |
| Asian | 23,813 | 100 | 43 |
30 |
19 |
9 |
87.1 | 61.0 |
15,589 |
| Hispanic/Latino | 66,327 | 99 | 8 |
21 |
33 |
37 |
60.1 | 46.0 |
39,899 |
| Native American | 1,434 | 99 | 15 |
28 |
33 |
25 |
69.8 | 46.0 |
910 |
| White | 360,042 | 99 | 27 |
34 |
26 |
12 |
82.2 | 51.0 |
243,073 |
| |
| Other Student Groups |
| Male | 257,786 | 99 | 24 |
31 |
27 |
18 |
77.4 | 49.0 |
168,791 |
| Female | 243,881 | 99 | 24 |
32 |
28 |
16 |
78.0 | 52.0 |
161,487 |
| Title I | 130,244 | 99 | 10 |
24 |
35 |
31 |
64.0 | 47.0 |
85,553 |
| Non-Title I | 371,423 | 99 | 29 |
34 |
25 |
12 |
82.5 | 51.0 |
244,725 |
| Non-Low Income | 349,445 | 99 | 30 |
35 |
25 |
10 |
84.0 | 52.0 |
234,533 |
| EL | 22,443 | 99 | 6 |
15 |
31 |
48 |
51.9 | 48.0 |
11,168 |
| Former EL | 13,068 | 99 | 15 |
27 |
33 |
26 |
68.8 | 52.0 |
8,857 |
| 1st Yr EL* | | - | - | - | - | - | - | - | - |
| Migrant | 48 | 98 | 2 |
31 |
33 |
33 |
59.4 | 54.0 |
33 |
| Native Hawaiian/ Pacific Islander | 562 | 98 | 23 |
28 |
27 |
22 |
74.7 | 55.0 |
318 |
| Multi-race - Non-Hispanic/Latino | 8,953 | 99 | 23 |
29 |
29 |
19 |
76.3 | 50.0 |
5,756 |
| |
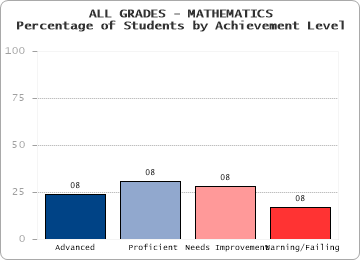
| All Students |
| 2008 | 501,976 | 99 | 24 |
31 |
28 |
17 |
77.7 | 50.0 |
330,279 |
| 2007 | | - | - | - | - | - | - | - | - |
 |
|


 Contact Information
 Part 3: Assessment
