| GRADE 10 - ENGLISH LANGUAGE ARTS |
|---|
| ACHIEVEMENT LEVEL | 2019 | 2021 | 2022 | | Exceeding Expectations (E) | 3 | 8 | 7 | | Meeting Expectations (M) | 44 | 48 | 47 | | Partially Meeting Expectations (PM) | 48 | 40 | 41 | | Not Meeting Expectations (NM) | 5 | 5 | 4 |
2022 Participation Rate = 98% | | |
|
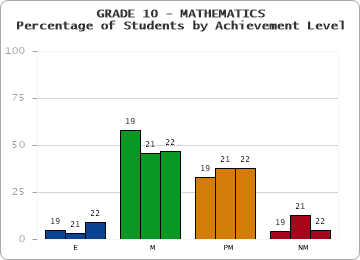
| GRADE 10 - MATHEMATICS |
|---|
| ACHIEVEMENT LEVEL | 2019 | 2021 | 2022 | | Exceeding Expectations (E) | 5 | 3 | 9 | | Meeting Expectations (M) | 58 | 46 | 47 | | Partially Meeting Expectations (PM) | 33 | 38 | 38 | | Not Meeting Expectations (NM) | 4 | 13 | 5 |
2022 Participation Rate = 100% | | |
|
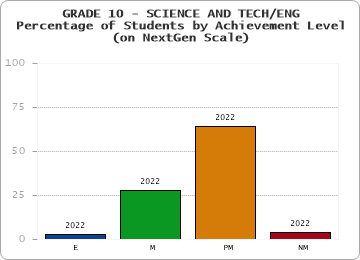
| GRADE 10 - SCIENCE AND TECH/ENG (on NextGen Scale) |
|---|
| ACHIEVEMENT LEVEL | 2022 | | Exceeding Expectations (E) | 3 | | Meeting Expectations (M) | 28 | | Partially Meeting Expectations (PM) | 64 | | Not Meeting Expectations (NM) | 4 |
2022 Participation Rate = 99% | | |
|
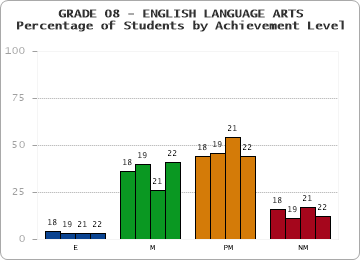
| GRADE 08 - ENGLISH LANGUAGE ARTS |
|---|
| ACHIEVEMENT LEVEL | 2018 | 2019 | 2021 | 2022 | | Exceeding Expectations (E) | 4 | 3 | 3 | 3 | | Meeting Expectations (M) | 36 | 40 | 26 | 41 | | Partially Meeting Expectations (PM) | 44 | 46 | 54 | 44 | | Not Meeting Expectations (NM) | 16 | 11 | 17 | 12 |
2022 Participation Rate = 99% | | |
|
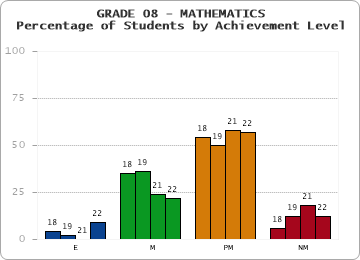
| GRADE 08 - MATHEMATICS |
|---|
| ACHIEVEMENT LEVEL | 2018 | 2019 | 2021 | 2022 | | Exceeding Expectations (E) | 4 | 2 | 0 | 9 | | Meeting Expectations (M) | 35 | 36 | 24 | 22 | | Partially Meeting Expectations (PM) | 54 | 50 | 58 | 57 | | Not Meeting Expectations (NM) | 6 | 12 | 18 | 12 |
2022 Participation Rate = 99% | | |
|
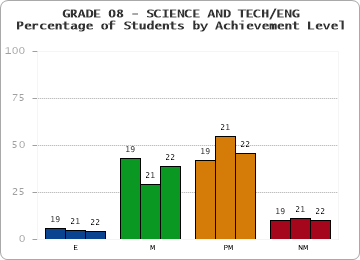
| GRADE 08 - SCIENCE AND TECH/ENG |
|---|
| ACHIEVEMENT LEVEL | 2019 | 2021 | 2022 | | Exceeding Expectations (E) | 6 | 5 | 4 | | Meeting Expectations (M) | 43 | 29 | 39 | | Partially Meeting Expectations (PM) | 42 | 55 | 46 | | Not Meeting Expectations (NM) | 10 | 11 | 10 |
2022 Participation Rate = 100% | | |
|
| GRADE 07 - ENGLISH LANGUAGE ARTS |
|---|
| ACHIEVEMENT LEVEL | 2018 | 2019 | 2021 | 2022 | | Exceeding Expectations (E) | 7 | 8 | 7 | 3 | | Meeting Expectations (M) | 33 | 43 | 39 | 34 | | Partially Meeting Expectations (PM) | 47 | 41 | 41 | 49 | | Not Meeting Expectations (NM) | 14 | 8 | 13 | 15 |
2022 Participation Rate = 97% | | |
|
| GRADE 07 - MATHEMATICS |
|---|
| ACHIEVEMENT LEVEL | 2018 | 2019 | 2021 | 2022 | | Exceeding Expectations (E) | 3 | 13 | 0 | 3 | | Meeting Expectations (M) | 49 | 36 | 35 | 25 | | Partially Meeting Expectations (PM) | 42 | 46 | 50 | 60 | | Not Meeting Expectations (NM) | 6 | 6 | 15 | 11 |
2022 Participation Rate = 100% | | |
|
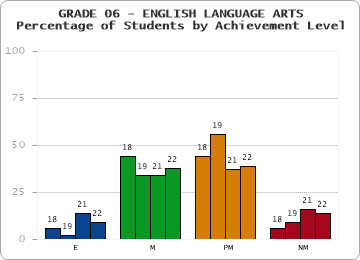
| GRADE 06 - ENGLISH LANGUAGE ARTS |
|---|
| ACHIEVEMENT LEVEL | 2018 | 2019 | 2021 | 2022 | | Exceeding Expectations (E) | 6 | 2 | 14 | 9 | | Meeting Expectations (M) | 44 | 34 | 34 | 38 | | Partially Meeting Expectations (PM) | 44 | 56 | 37 | 39 | | Not Meeting Expectations (NM) | 6 | 9 | 16 | 14 |
2022 Participation Rate = 99% | | |
|
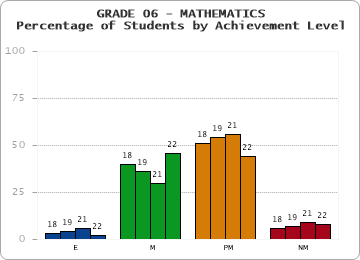
| GRADE 06 - MATHEMATICS |
|---|
| ACHIEVEMENT LEVEL | 2018 | 2019 | 2021 | 2022 | | Exceeding Expectations (E) | 3 | 4 | 6 | 2 | | Meeting Expectations (M) | 40 | 36 | 30 | 46 | | Partially Meeting Expectations (PM) | 51 | 54 | 56 | 44 | | Not Meeting Expectations (NM) | 6 | 7 | 9 | 8 |
2022 Participation Rate = 98% | | |
|
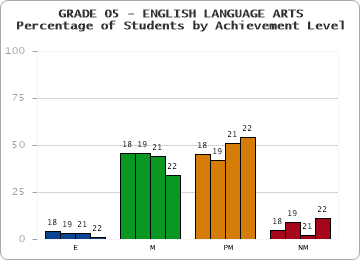
| GRADE 05 - ENGLISH LANGUAGE ARTS |
|---|
| ACHIEVEMENT LEVEL | 2018 | 2019 | 2021 | 2022 | | Exceeding Expectations (E) | 4 | 3 | 3 | 1 | | Meeting Expectations (M) | 46 | 46 | 44 | 34 | | Partially Meeting Expectations (PM) | 45 | 42 | 51 | 54 | | Not Meeting Expectations (NM) | 5 | 9 | 2 | 11 |
2022 Participation Rate = 100% | | |
|
| GRADE 05 - MATHEMATICS |
|---|
| ACHIEVEMENT LEVEL | 2018 | 2019 | 2021 | 2022 | | Exceeding Expectations (E) | 1 | 0 | 2 | 1 | | Meeting Expectations (M) | 19 | 33 | 29 | 24 | | Partially Meeting Expectations (PM) | 74 | 53 | 65 | 61 | | Not Meeting Expectations (NM) | 6 | 14 | 4 | 14 |
2022 Participation Rate = 98% | | |
|
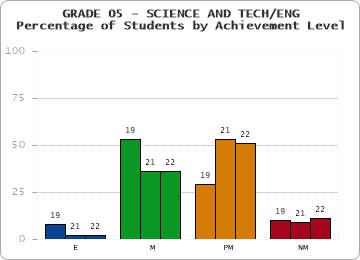
| GRADE 05 - SCIENCE AND TECH/ENG |
|---|
| ACHIEVEMENT LEVEL | 2019 | 2021 | 2022 | | Exceeding Expectations (E) | 8 | 2 | 2 | | Meeting Expectations (M) | 53 | 36 | 36 | | Partially Meeting Expectations (PM) | 29 | 53 | 51 | | Not Meeting Expectations (NM) | 10 | 9 | 11 |
2022 Participation Rate = 100% | | |
|
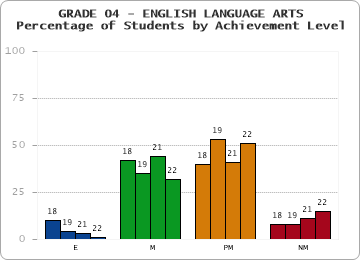
| GRADE 04 - ENGLISH LANGUAGE ARTS |
|---|
| ACHIEVEMENT LEVEL | 2018 | 2019 | 2021 | 2022 | | Exceeding Expectations (E) | 10 | 4 | 3 | 1 | | Meeting Expectations (M) | 42 | 35 | 44 | 32 | | Partially Meeting Expectations (PM) | 40 | 53 | 41 | 51 | | Not Meeting Expectations (NM) | 8 | 8 | 11 | 15 |
2022 Participation Rate = 95% | | |
|
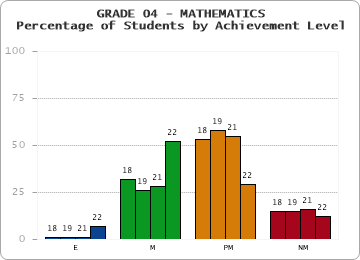
| GRADE 04 - MATHEMATICS |
|---|
| ACHIEVEMENT LEVEL | 2018 | 2019 | 2021 | 2022 | | Exceeding Expectations (E) | 1 | 1 | 1 | 7 | | Meeting Expectations (M) | 32 | 26 | 28 | 52 | | Partially Meeting Expectations (PM) | 53 | 58 | 55 | 29 | | Not Meeting Expectations (NM) | 15 | 15 | 16 | 12 |
2022 Participation Rate = 97% | | |
|
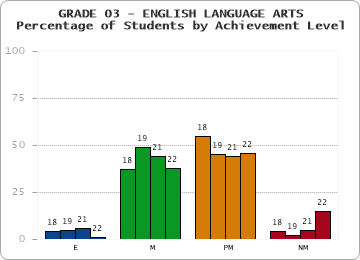
| GRADE 03 - ENGLISH LANGUAGE ARTS |
|---|
| ACHIEVEMENT LEVEL | 2018 | 2019 | 2021 | 2022 | | Exceeding Expectations (E) | 4 | 5 | 6 | 1 | | Meeting Expectations (M) | 37 | 49 | 44 | 38 | | Partially Meeting Expectations (PM) | 55 | 45 | 44 | 46 | | Not Meeting Expectations (NM) | 4 | 2 | 5 | 15 |
2022 Participation Rate = 100% | | |
|
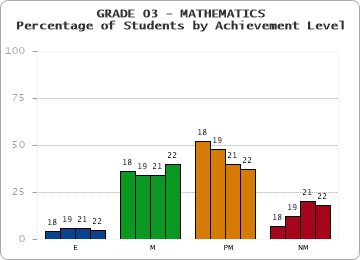
| GRADE 03 - MATHEMATICS |
|---|
| ACHIEVEMENT LEVEL | 2018 | 2019 | 2021 | 2022 | | Exceeding Expectations (E) | 4 | 6 | 6 | 5 | | Meeting Expectations (M) | 36 | 34 | 34 | 40 | | Partially Meeting Expectations (PM) | 52 | 48 | 40 | 37 | | Not Meeting Expectations (NM) | 7 | 12 | 20 | 18 |
2022 Participation Rate = 100% | | |
|
MCAS Annual Comparisons
| GRADE 10 - SCIENCE AND TECH/ENG (on Legacy Scale) |
|---|
| ACHIEVEMENT LEVEL | 2018 | 2019 | 2022 | | ADVANCED | 25 | 14 | 12 | | PROFICIENT | 54 | 45 | 47 | | NEEDS IMPROVEMENT | 21 | 39 | 39 | | FAILING | 1 | 2 | 2 | | |
|
NOTE: Grade 10 results for spring 2021 STE are not provided because students in the class of 2023 were not required to take the STE test.Information about CD requirements is available at https://www.doe.mass.edu/mcas/graduation.html.
NOTE: The Massachusetts Department of Elementary and Secondary Education did not administer Spring 2020 MCAS for the 2019-2020 school year due to the cancellation of state assessments and school closures related to COVID-19.
NOTE: Grade 10 STE results are presented on both the Next Generation scale (first table) and the Legacy scale (second table). Scholarships and Competency Determination (CD) for graduation use students' results on the Legacy scale through the class of 2025. Information about CD requirements is available at https://www.doe.mass.edu/mcas/graduation.html.