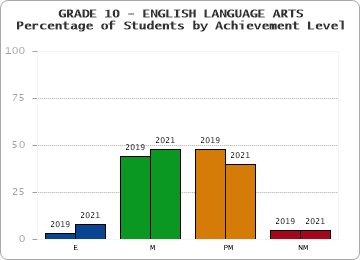
| GRADE 10 - ENGLISH LANGUAGE ARTS |
|---|
| ACHIEVEMENT LEVEL | 2019 | 2021 | | Exceeding Expectations (E) | 3 | 8 | | Meeting Expectations (M) | 44 | 48 | | Partially Meeting Expectations (PM) | 48 | 40 | | Not Meeting Expectations (NM) | 5 | 5 |
2021 Participation Rate = 86% | | |
|
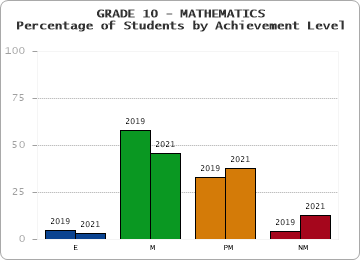
| GRADE 10 - MATHEMATICS |
|---|
| ACHIEVEMENT LEVEL | 2019 | 2021 | | Exceeding Expectations (E) | 5 | 3 | | Meeting Expectations (M) | 58 | 46 | | Partially Meeting Expectations (PM) | 33 | 38 | | Not Meeting Expectations (NM) | 4 | 13 |
2021 Participation Rate = 87% | | |
|
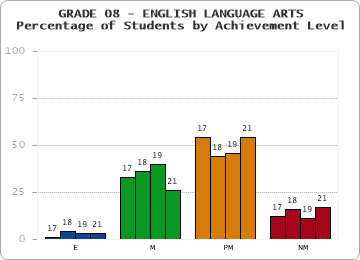
| GRADE 08 - ENGLISH LANGUAGE ARTS |
|---|
| ACHIEVEMENT LEVEL | 2017 | 2018 | 2019 | 2021 | | Exceeding Expectations (E) | 1 | 4 | 3 | 3 | | Meeting Expectations (M) | 33 | 36 | 40 | 26 | | Partially Meeting Expectations (PM) | 54 | 44 | 46 | 54 | | Not Meeting Expectations (NM) | 12 | 16 | 11 | 17 |
2021 Participation Rate = 87% | | |
|
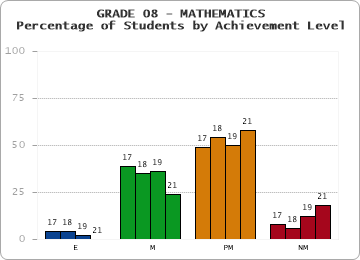
| GRADE 08 - MATHEMATICS |
|---|
| ACHIEVEMENT LEVEL | 2017 | 2018 | 2019 | 2021 | | Exceeding Expectations (E) | 4 | 4 | 2 | 0 | | Meeting Expectations (M) | 39 | 35 | 36 | 24 | | Partially Meeting Expectations (PM) | 49 | 54 | 50 | 58 | | Not Meeting Expectations (NM) | 8 | 6 | 12 | 18 |
2021 Participation Rate = 85% | | |
|
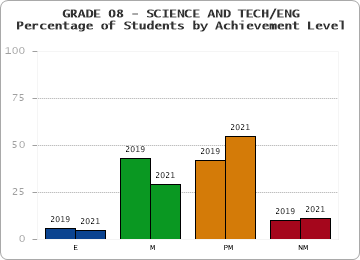
| GRADE 08 - SCIENCE AND TECH/ENG |
|---|
| ACHIEVEMENT LEVEL | 2019 | 2021 | | Exceeding Expectations (E) | 6 | 5 | | Meeting Expectations (M) | 43 | 29 | | Partially Meeting Expectations (PM) | 42 | 55 | | Not Meeting Expectations (NM) | 10 | 11 |
2021 Participation Rate = 87% | | |
|
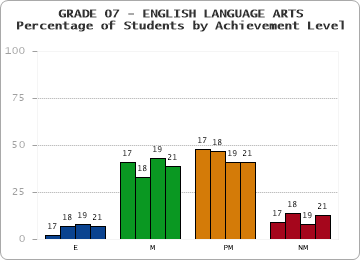
| GRADE 07 - ENGLISH LANGUAGE ARTS |
|---|
| ACHIEVEMENT LEVEL | 2017 | 2018 | 2019 | 2021 | | Exceeding Expectations (E) | 2 | 7 | 8 | 7 | | Meeting Expectations (M) | 41 | 33 | 43 | 39 | | Partially Meeting Expectations (PM) | 48 | 47 | 41 | 41 | | Not Meeting Expectations (NM) | 9 | 14 | 8 | 13 |
2021 Participation Rate = 94% | | |
|
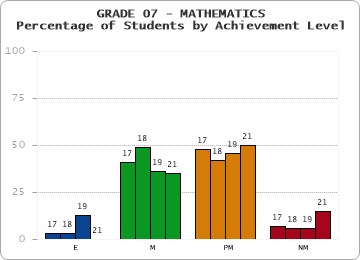
| GRADE 07 - MATHEMATICS |
|---|
| ACHIEVEMENT LEVEL | 2017 | 2018 | 2019 | 2021 | | Exceeding Expectations (E) | 3 | 3 | 13 | 0 | | Meeting Expectations (M) | 41 | 49 | 36 | 35 | | Partially Meeting Expectations (PM) | 48 | 42 | 46 | 50 | | Not Meeting Expectations (NM) | 7 | 6 | 6 | 15 |
2021 Participation Rate = 93% | | |
|
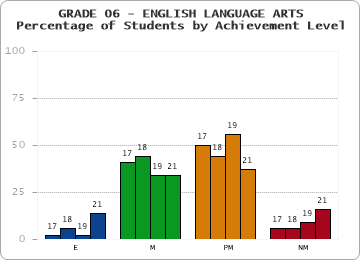
| GRADE 06 - ENGLISH LANGUAGE ARTS |
|---|
| ACHIEVEMENT LEVEL | 2017 | 2018 | 2019 | 2021 | | Exceeding Expectations (E) | 2 | 6 | 2 | 14 | | Meeting Expectations (M) | 41 | 44 | 34 | 34 | | Partially Meeting Expectations (PM) | 50 | 44 | 56 | 37 | | Not Meeting Expectations (NM) | 6 | 6 | 9 | 16 |
2021 Participation Rate = 100% | | |
|
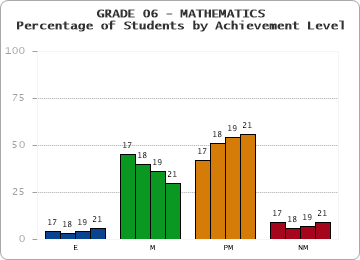
| GRADE 06 - MATHEMATICS |
|---|
| ACHIEVEMENT LEVEL | 2017 | 2018 | 2019 | 2021 | | Exceeding Expectations (E) | 4 | 3 | 4 | 6 | | Meeting Expectations (M) | 45 | 40 | 36 | 30 | | Partially Meeting Expectations (PM) | 42 | 51 | 54 | 56 | | Not Meeting Expectations (NM) | 9 | 6 | 7 | 9 |
2021 Participation Rate = 100% | | |
|
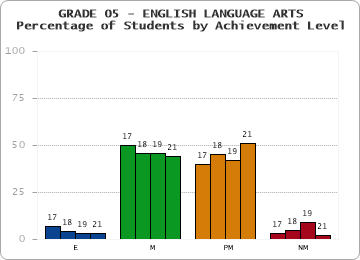
| GRADE 05 - ENGLISH LANGUAGE ARTS |
|---|
| ACHIEVEMENT LEVEL | 2017 | 2018 | 2019 | 2021 | | Exceeding Expectations (E) | 7 | 4 | 3 | 3 | | Meeting Expectations (M) | 50 | 46 | 46 | 44 | | Partially Meeting Expectations (PM) | 40 | 45 | 42 | 51 | | Not Meeting Expectations (NM) | 3 | 5 | 9 | 2 |
2021 Participation Rate = 93% | | |
|
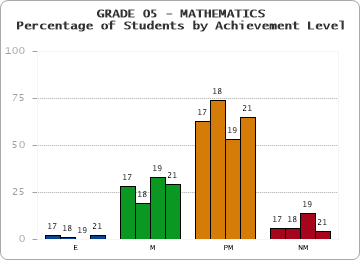
| GRADE 05 - MATHEMATICS |
|---|
| ACHIEVEMENT LEVEL | 2017 | 2018 | 2019 | 2021 | | Exceeding Expectations (E) | 2 | 1 | 0 | 2 | | Meeting Expectations (M) | 28 | 19 | 33 | 29 | | Partially Meeting Expectations (PM) | 63 | 74 | 53 | 65 | | Not Meeting Expectations (NM) | 6 | 6 | 14 | 4 |
2021 Participation Rate = 93% | | |
|
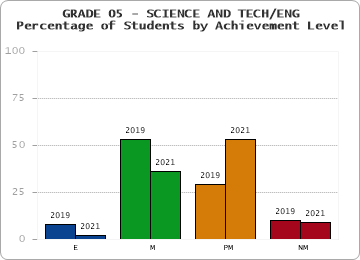
| GRADE 05 - SCIENCE AND TECH/ENG |
|---|
| ACHIEVEMENT LEVEL | 2019 | 2021 | | Exceeding Expectations (E) | 8 | 2 | | Meeting Expectations (M) | 53 | 36 | | Partially Meeting Expectations (PM) | 29 | 53 | | Not Meeting Expectations (NM) | 10 | 9 |
2021 Participation Rate = 93% | | |
|
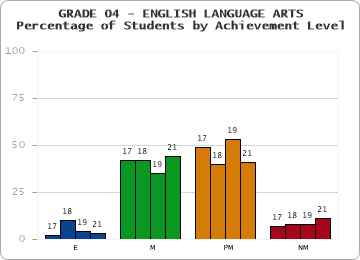
| GRADE 04 - ENGLISH LANGUAGE ARTS |
|---|
| ACHIEVEMENT LEVEL | 2017 | 2018 | 2019 | 2021 | | Exceeding Expectations (E) | 2 | 10 | 4 | 3 | | Meeting Expectations (M) | 42 | 42 | 35 | 44 | | Partially Meeting Expectations (PM) | 49 | 40 | 53 | 41 | | Not Meeting Expectations (NM) | 7 | 8 | 8 | 11 |
2021 Participation Rate = 98% | | |
|
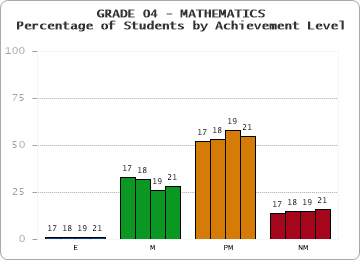
| GRADE 04 - MATHEMATICS |
|---|
| ACHIEVEMENT LEVEL | 2017 | 2018 | 2019 | 2021 | | Exceeding Expectations (E) | 1 | 1 | 1 | 1 | | Meeting Expectations (M) | 33 | 32 | 26 | 28 | | Partially Meeting Expectations (PM) | 52 | 53 | 58 | 55 | | Not Meeting Expectations (NM) | 14 | 15 | 15 | 16 |
2021 Participation Rate = 97% | | |
|
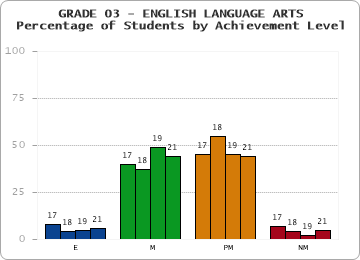
| GRADE 03 - ENGLISH LANGUAGE ARTS |
|---|
| ACHIEVEMENT LEVEL | 2017 | 2018 | 2019 | 2021 | | Exceeding Expectations (E) | 8 | 4 | 5 | 6 | | Meeting Expectations (M) | 40 | 37 | 49 | 44 | | Partially Meeting Expectations (PM) | 45 | 55 | 45 | 44 | | Not Meeting Expectations (NM) | 7 | 4 | 2 | 5 |
2021 Participation Rate = 93% | | |
|
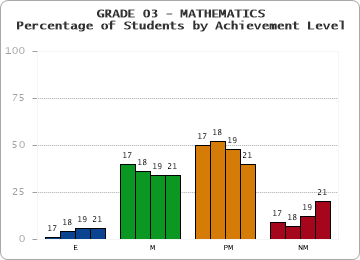
| GRADE 03 - MATHEMATICS |
|---|
| ACHIEVEMENT LEVEL | 2017 | 2018 | 2019 | 2021 | | Exceeding Expectations (E) | 1 | 4 | 6 | 6 | | Meeting Expectations (M) | 40 | 36 | 34 | 34 | | Partially Meeting Expectations (PM) | 50 | 52 | 48 | 40 | | Not Meeting Expectations (NM) | 9 | 7 | 12 | 20 |
2021 Participation Rate = 94% | | |
|
NOTE: Grade 10 results for spring 2021 STE are not provided because students in the class of 2023 were not required to take the STE test.
Information about CD requirements is available at https://www.doe.mass.edu/mcas/graduation.html.
Participation rates varied across schools, districts, and student groups in 2021 more than in prior years.
If the participation rate in 2021 was lower than in prior years, results may have been different if more students had taken the test.


 Massachusetts